samedi 8 décembre 2018

AUD/USD, AUD/JPY and EUR/AUD Trend Lines Broken. Reversals Extend


Talking Points – AUD/USD, AUD/JPY, EUR/AUD, RSI Divergence

  • As anticipated, AUD/USD and AUD/JPY turned lower after negative RSI divergences
  • Meanwhile, EUR/AUD had its best week since January after positive RSI divergence
  • These currencies may extend their performance as the Australian Dollar takes a hit

Have a question about what’s in store for Australian Dollar next week? Join a Trading Q&A Webinarto ask it live!

AUD/USD Technical Outlook: Bearish

Last week, we noted multiple RSI divergence reversal signals in AUD/USD, AUD/JPY and EUR/AUD. The significance of divergence is that it shows fading momentum. These provided early warning signals that the Australian Dollar might have been on the verge of depreciating against most of its major peers. That was indeed the case for all three mentioned above.

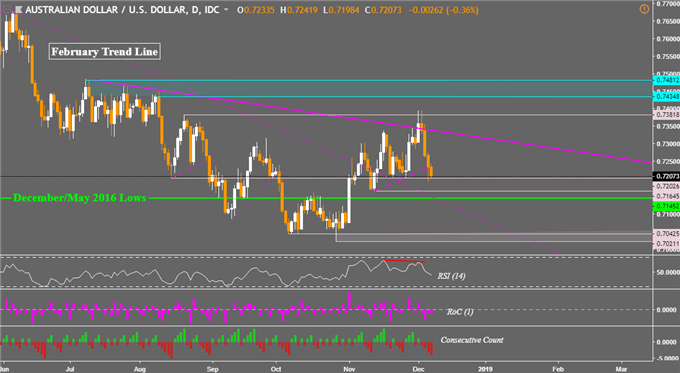
Starting with AUD/USD, the pair turned lower after failing to push above the descending resistance line from July. Here, negative RSI divergence preceded a turn lower as Aussie Dollar headed for its lowest close since mid-November. Prices are now sitting right on horizontal support at 0.72026 which begins with the August 15th low. We did have a descent through a near-term rising support line from November 13th and more declines could be in store ahead. A push through 0.71452 exposes the current 2018 lows.

AUD/USD Daily Chart

AUD/USD, AUD/JPY and EUR/AUD Trend Lines Broken. Reversals Extend

AUD/JPY Technical Outlook:Bearish

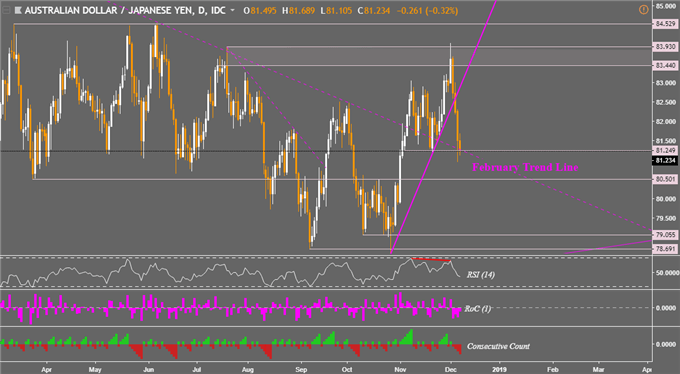
Negative RSI divergence was also present in AUD/JPY last week, since then the pair fell about 3.35%. In its descent, AUD/JPY fell through a rising support line from October which is a bearish signal. But, prices have paused their descent at the February trend line on the chart below. This is also combined with horizontal support at 81.24. Still, AUD/JPY was heading for its lowest close since early November and more losses may be in the cards ahead. Near-term support is at 80.50.

AUD/JPY Daily Chart

AUD/USD, AUD/JPY and EUR/AUD Trend Lines Broken. Reversals Extend

EUR/AUD Technical Outlook:Bullish

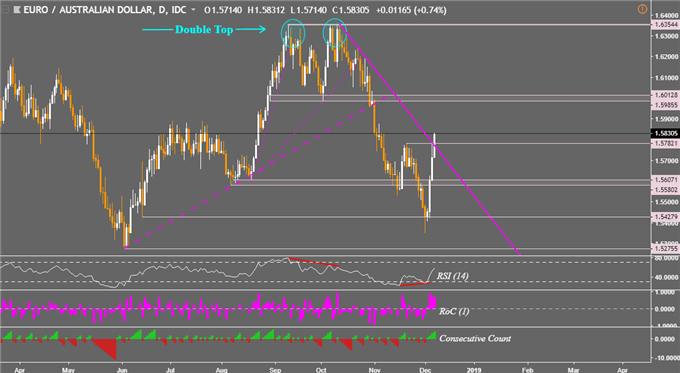
Meanwhile, last week EUR/AUD was overshadowed by positive RSI divergence and that ended up preceding its best weekly performance (about 2.25%) since the last week of January this year. That also brought with it a push above a descending trend line from October. With confirmation of a turn higher, EUR/AUD could be on the verge of reversing its dominant downtrend which was initiated by a double top reversal candlestick pattern. From here, near-term resistance is a range between 1.5985 and 1.6012.

For updates on my coverage of the Australian Dollar, you may follow me on twitter @ddubrovsky for real-time news on major moves in Aussie crosses.

EUR/AUD Daily Chart

AUD/USD, AUD/JPY and EUR/AUD Trend Lines Broken. Reversals Extend

** Charts created in TradingView

— Written by Daniel Dubrovsky, Junior Currency Analyst for DailyFX.com

To contact Daniel, use the comments section below or @ddubrovskyFX on Twitter

Other Weekly Technical Forecast:


Source link


https://ift.tt/2Psv9d0

Price Breakout Approaching Initial Targets


Gold Technical Outlook: Price Breakout Approaching Initial Targets

A breach above the November range takes gold prices near five-month highs. Here are the targets & invalidation levels that matter on the XAU/USD charts next week.

A breach above the November range highs has taken gold prices to levels not seen since mid-July and keeps the focus higher heading into next week. These are the updated targets and invalidation levels that matter on the XAU/USD charts.

New to Gold Trading? Get started with this Free How to Trade Gold -Beginners Guide

Gold Daily Price Chart (XAU/USD)

Daily Chart of Gold

Technical Outlook: In our last Gold Technical Outlook we noted that a breakout was imminent as price was testing the October trendline. Out ‘bottom line’ cited that “The monthly opening-range remains intact heading into the November close. For now, look for a break of this week’s range for guidance with our broader focus higher while within this ascending pitchfork formation. From a trading standpoint, I continue to favor fading weakness while above 1210.”

Gold rallied through critical resistance early in the week with the advance taking out the November range highs on the way. Daily resistance targets are eyed at the August 2017 low at 1252 backed by the 200-day moving average and the 50% retracement of the yearly range at 1262. Broader bullish invalidation now raised to 1214.

Why does the average trader lose? Avoid these Mistakes in your trading

Gold 240min Price Chart (XAU/USD)

4 hour chart of gold

Notes:A closer look at price action sees the advance off the November lows holding within the confines of this slope series (red) and suggests the immediate advance may be vulnerable here heading in to the close of the week. Interim support rests at 1236 – a break there would suggest a larger pullback towards the lower parallels at 1227 and the monthly open at 1221– the near-term focus remains higher while above this level with a topside breach targeting subsequent resistance objectives at 1252, 1260 and 1262.

Learn how to Trade with Confidence in our Free Trading Guide

Bottom line: We’ll favor fading weakness near-term while above the monthly open targeting the upper parallels. From a trading standpoint, a good place to reduce long-exposure / raise protective stops; IF we get a pullback, look for more favorable entries towards slope support next week.

For a complete breakdown of Michael’s trading strategy, review his Foundations of Technical Analysis series on Building a Trading Strategy

Gold Trader Sentiment

Gold Technical Outlook: Price Breakout Approaching Initial Targets

  • A summary of IG Client Sentiment shows traders are net-long Gold – the ratio stands at +3.14 (75.8% of traders are long) – bearishreading
  • Long positions are4.4% lower than yesterday and 6.4% lower from last week
  • Short positions are 3.6% higher than yesterday and 35.0% higher from last week
  • We typically take a contrarian view to crowd sentiment, and the fact traders are net-long suggests Gold prices may continue to fall. Yet traders are less net-long than yesterday & compared with last week and the recent changes in sentiment warn that the current Gold price trend may soon reverse higher despite the fact traders remain net-long.

– Written by Michael Boutros, Currency Strategist with DailyFX

Follow Mchael on Twitter @MBForex or contact him at mboutros@dailyfx.com

Other Weekly Technical Forecast:

Australian Dollar Forecast – AUD/USD, AUD/JPY and EUR/AUD Trend Lines Broken

British Pound Forecast – Sterling Remains Weak

US Dollar Forecast – Dollar Wind Up Threatens to Resolve with a Break Before 2018 Ends

Equity Forecast – Technical Forecast for the S&P 500, Dow Jones, DAX 30 & FTSE


Source link


https://ift.tt/2QnR1fd

Canadian Dollar’s Shifting Sentiment May Boost Short Term Prospects


USDCAD Chart

Fundamental Forecast for CAD: Bullish

Talking Points:

  • Expectations for future Bank of Canada interest rate hikes drop
  • OPEC agreement to cut oil production to support the Loonie
  • Event risk to the US Dollar may benefit its Canadian Dollar counterpart

The Canadian Dollar depreciated slightly against its US Dollar counterpart from the 1.3250 level to 1.3300 USD/CAD over the last week of trading. This occurred against a volatile backdrop due to the anticipated policy interest rate decision from the Bank of Canada (BOC), releases of key economic data and speculation over OPEC leaders gathering to agree on curbing oil output.

As widely expected, the BOC decided to maintain their overnight policy rate target at 1.75 percent. In its press release immediately following the decision, Canada’s central bank struck a cautious tone over recent economic developments at home and globally. Key concerns cited cratering oil prices, muted business investment and slowing growth across major developed countries. Consequently, markets interpreted the comments as dovish and significantly reduced their expectations for future rate hikes. However, the steep drop in expectations could be an exaggerated knee-jerk reaction.

BOC Meeting Hike Probabilities

The implied probability of future rate hikes declined for most of November paralleling oil’s steep selloff over the period due to a worsening supply glut as fears of a deteriorating global economy mount. BOC noted that the country’s energy industry “will likely be materially weaker than expected.” In turn, this may evolve into a major headwind for the Canadian economy as well as the Canadian Dollar seeing that oil production accounts for $170 billion out of the country’s $1.8 trillion GDP – just shy of 10 percent of total economic output. While the BOC stated that the Canadian economy expanded in line with projections for the third quarter, this could change over the final months of the year as economic data is suggesting positive momentum is fading.

On a more positive note, business investment should pick up with the recently signed US-Mexico-Canada (USMCA) agreement providing more clarity on trade between the countries. Also, employment numbers reported at the end of the week surprised to the upside. The Canadian unemployment rate dropped to 5.6 percent from 5.8 percent and the net change in employment crushed forecasts by adding over 94,000 jobs compared to the expected 10,000. Another development that could support a beaten down Loonie is the recent agreement by OPEC and its partners to cut oil production by 1.2 million barrels per day. Crude oil leapt nearly 6 percent on the news which also sent the Canadian Dollar higher.

The data dependent BOC will closely examine housing stats reported next week as it looks for signs of a sustained rebound across the sector. As for its American counterpart, the US market could come under pressure from highly anticipated data points that pose material downside event risk to the Greenback. With the US Dollar already starting to lose some of its luster due to weaker than expected economic developments and seemingly dovish remarks from the Federal Reserve, the USDCAD could see some downside in the short term due to the recent shift in sentiment.

–Written by Rich Dvorak, Junior Analyst for DailyFX.com

–Follow on Twitter @RichDvorakFX

Other Weekly Fundamental Forecast:

Japanese Yen Forecast – USD/JPY to Track October Range as Attention Turns to U.S. CPI

Oil Forecast – OPEC And Friends Production Cut Exceeds Expectations, Crude Rallies


Source link


https://ift.tt/2RFE3pD

Sigelbaum joins TR to lead FXall


Jill Sigelbaum replaces John Cooley, who left Thomson Reuters in November


Source link


https://ift.tt/2QjTKpL

Huobi Opens First Russian Office in Partnership with State Bank’s Digital Tech Center


Singapore-based cryptocurrency exchange Huobi has officially launched its first branch in Russia on Thursday, Dec. 6, according to a press release shared with Cointelegraph today.

The Moscow-based exchange, dubbed Huobi Russia, is established in partnership with the state-owned Russian Development Bank’s (VEB) Digital Transformation Center and supported by Huobi’s regional exchange partnership program, Huobi Cloud.

The Center of Digital Transformation was created by VEB to promote blockchain and other crypto-related technologies, as its website states.

Back in September of this year, Huobi first joined Russia’s VEB Innovation Fund and became a resident of the Digital Transformation Center to share experience on crypto regulation, with the fund’s CEO claiming that Huobi’s expertise will assist in building a “legal basis that could compete with current promising jurisdictions.”

Speaking at a private event on Thursday, Huobi senior business director David Chen claimed that the launch of Huobi Russia will help to promote the company’s “leading technology and trading expertise to Russian users,” including such skills as “unmatched safety, stability, and user experience.”

Huobi Russia CEO Andrei Grachev also noted the increasing volumes of crypto trading in Russia, claiming that the volumes have “recently exceeded US $20 million in a single day,” regardless of the current bear market.

Russia’s VEB Innovation Fund, created in 2011, is reportedly the “first” Russian specialized center for support and development of disruptive technologies in the fields of management and the functioning of enterprises and government corporations, according to the center’s website.

The innovation center is exploring and implementing various blockchain projects, and houses more than 20 branches of major blockchain and tech companies such as the Ethereum Foundation, Bitcoin (BTC) tech company Bitfury, PricewaterhouseCoopers (PwC), and others.

Vladimir Demin, chairman of VEB’s Innovation Fund, claimed that Russia is “actively promoting the blockchain market,” with VEB willing to play an “important role as a leader in blockchain research and legislation,” as reported in the press release.

Founded in 1922, VEB bank, or “the state corporation Bank for Development and Foreign Economic Affairs,” is the first international bank of the Soviet Union, originally named Roskombank. The bank is responsible for developing the Russian economy, as well as managing Russia’s state debts and pension funds.

Other Russian banks have also shown an interest in blockchain technology.

Recently, major Russian state-backed bank Sberbank conducted an over-the-counter (OTC) monetary repurchase agreement based on blockchain technology. And earlier in November, the Russian branch of Raiffeisen Bank International teamed up with local state oil giant Gazprom Neft to issue a blockchain-enabled bank guarantee.


Source link


https://ift.tt/2G4mmyQ

Forex Tips For Newbies To Keep A Strong Account – SDEFX™


Learn Forex today The So Darn Easy Way™. So Darn Easy Forex strategies are easy to understand and taught in layman’s terms. Get started with your Forex …

source


https://ift.tt/2RLe3sP

Technical Forecast for the S&P 500, Dow Jones, DAX 30 & FTSE


What’s inside:

  • S&P 500 and Dow look to maintain above support
  • DAX 30 closed week below major long-term support
  • FTSE broke March support, now resistance

Looking for forecasts, trade ideas, and educational content? Whether you just got started or have been trading for a while we’ve got you covered on the DailyFX Trading Guides page.

S&P 500 and Dow look to maintain above support

Thursday’s sharp drop and reverse in the S&P 500 has support validated down around the lows from October and November along with the trend-line from early this year. Looking for the market to stabilize a bit, but remain volatile, just perhaps not as volatile as recently. A rebound isn’t likely to last long, however, as general tone and resistance should cap any move higher. For the trend lower to really take hold it will require a break of 2603. It’s a market for the very short-term minded trader as swings in price are quick to wipe out profits.

S&P 500 Daily Chart (Remains supported for now)

Daily chart of S&P 500

The Dow Jones still refuses to close below the February 2016 trend-line that the S&P 500 has long left behind already. The Thursday reversal took shape from just below this important long-term threshold around the lows from Oct/Nov and the trend-line from the low in February. On the top-side lies a trend-line running down from the record high which capped the gap on Monday. The convergence of bottom and top-side lines could start to dampen volatility, but lead to a potentially explosive opportunity down the road. For now, it’s a vol traders market, back-and-forth.

See the IG Client Sentiment page to view how traders are reacting to the bout of stock market volatility.

Dow Jones Daily Chart (Reversed of confluent support)

Daily chart of DOW

DAX 30 closed week below major long-term support

Last week’s tag of the neckline of the long-term head-and-shoulders pattern and subsequent breaking of the 2011 trend-line on a weekly closing basis as the big-picture outlook firmly bearish. While minor support from 2016 may keep the DAX buoyed near-term, a move higher from here is viewed as a seller’s bounce. The area immediately surrounding 11k is first up as resistance, followed by a retest of the broken 2011 trend-line. On a break below last week’s low of 10762 (2016 support), the next levels of are 10402 and then 10175.

DAX Daily Chart (Short-term support)

Daily chart of DAX

DAX Weekly Chart (Weekly close below 2011 trend-line)

Weekly chart of the DAX

FTSE 100 broke March support, now resistance

The Thursday break took out March/October support and now has the FTSE continuing its move lower. Like the DAX, there is support from late 2016 which was met and held to end the week. And also like the DAX, a bounce from here is viewed as an opportunity for selling. The broken March/October support now becomes resistance on a bounce. A break below 6664 will keep the market reeling as visible support beneath that point is lacking. We could see a little digestion between support and resistance before any sustainable move develops.

FTSE 100 Daily Chart (Old support becomes new resistance)

Daily chart of the FTSE 100

—Written by Paul Robinson, Market Analyst

You can follow Paul on Twitter at@PaulRobinonFX.

Other Weekly Technical Forecast:

Australian Dollar Forecast – AUD/USD, AUD/JPY and EUR/AUD Trend Lines Broken

British Pound Forecast – Sterling Remains Weak

US Dollar Forecast – Dollar Wind Up Threatens to Resolve with a Break Before 2018 Ends


Source link


https://ift.tt/2rotQCs