Affichage des articles dont le libellé est Forex News. Afficher tous les articles

samedi 8 décembre 2018

Canadian Dollar’s Shifting Sentiment May Boost Short Term Prospects


USDCAD Chart

Fundamental Forecast for CAD: Bullish

Talking Points:

  • Expectations for future Bank of Canada interest rate hikes drop
  • OPEC agreement to cut oil production to support the Loonie
  • Event risk to the US Dollar may benefit its Canadian Dollar counterpart

The Canadian Dollar depreciated slightly against its US Dollar counterpart from the 1.3250 level to 1.3300 USD/CAD over the last week of trading. This occurred against a volatile backdrop due to the anticipated policy interest rate decision from the Bank of Canada (BOC), releases of key economic data and speculation over OPEC leaders gathering to agree on curbing oil output.

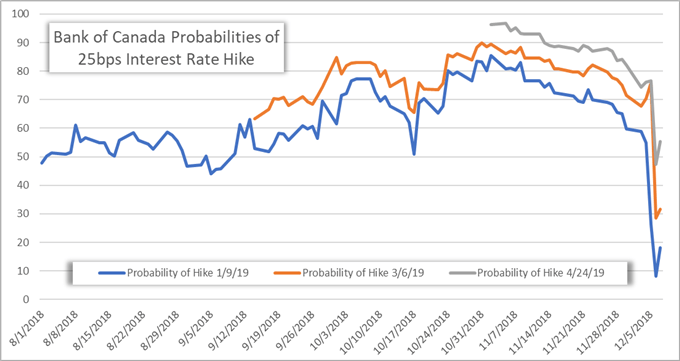
As widely expected, the BOC decided to maintain their overnight policy rate target at 1.75 percent. In its press release immediately following the decision, Canada’s central bank struck a cautious tone over recent economic developments at home and globally. Key concerns cited cratering oil prices, muted business investment and slowing growth across major developed countries. Consequently, markets interpreted the comments as dovish and significantly reduced their expectations for future rate hikes. However, the steep drop in expectations could be an exaggerated knee-jerk reaction.

BOC Meeting Hike Probabilities

The implied probability of future rate hikes declined for most of November paralleling oil’s steep selloff over the period due to a worsening supply glut as fears of a deteriorating global economy mount. BOC noted that the country’s energy industry “will likely be materially weaker than expected.” In turn, this may evolve into a major headwind for the Canadian economy as well as the Canadian Dollar seeing that oil production accounts for $170 billion out of the country’s $1.8 trillion GDP – just shy of 10 percent of total economic output. While the BOC stated that the Canadian economy expanded in line with projections for the third quarter, this could change over the final months of the year as economic data is suggesting positive momentum is fading.

On a more positive note, business investment should pick up with the recently signed US-Mexico-Canada (USMCA) agreement providing more clarity on trade between the countries. Also, employment numbers reported at the end of the week surprised to the upside. The Canadian unemployment rate dropped to 5.6 percent from 5.8 percent and the net change in employment crushed forecasts by adding over 94,000 jobs compared to the expected 10,000. Another development that could support a beaten down Loonie is the recent agreement by OPEC and its partners to cut oil production by 1.2 million barrels per day. Crude oil leapt nearly 6 percent on the news which also sent the Canadian Dollar higher.

The data dependent BOC will closely examine housing stats reported next week as it looks for signs of a sustained rebound across the sector. As for its American counterpart, the US market could come under pressure from highly anticipated data points that pose material downside event risk to the Greenback. With the US Dollar already starting to lose some of its luster due to weaker than expected economic developments and seemingly dovish remarks from the Federal Reserve, the USDCAD could see some downside in the short term due to the recent shift in sentiment.

–Written by Rich Dvorak, Junior Analyst for DailyFX.com

–Follow on Twitter @RichDvorakFX

Other Weekly Fundamental Forecast:

Japanese Yen Forecast – USD/JPY to Track October Range as Attention Turns to U.S. CPI

Oil Forecast – OPEC And Friends Production Cut Exceeds Expectations, Crude Rallies


Source link


https://ift.tt/2RFE3pD

vendredi 7 décembre 2018

Why Does the US Yield Curve Inversion Matter?


Talking Points

– With US equity markets plunging this week, financial news media has been quick to point out movement in the bond market as the key catalyst.

– Certain measures of the US Treasury yield curve have started to invert, sparking fears that the US economy is heading towards a recession within the next two years.

– However, the two key yield spreads that traders need to watch – the 3m5s and 2s10s – have yet to invert, so recession fears should be contained for now.

See the DailyFX Economic Calendar and see what live coverage for key event risk impacting FX markets is scheduled for next week on the DailyFX Webinar Calendar.

US equity markets have been struggling the past few days, with a variety of reasons being offered up: Brexit; the US-China trade war; and the Federal Reserve’s rate hike path, among others. But a new explanation has appeared in recent days, one that has yet to make an appearance in 2018, or really at any point in the past decade: the inversion of the US Treasury yield curve.

Why Do Investors Look at the Yield Curve?

The yield curve, if it’s based on AA-rated corporate bonds, German Bunds, or US Treasuries, is a reflection of the relationship between risk and time for debt at various maturities. A “normal” yield curve is one in which shorter-term debt instruments have a lower yield than longer-term debt instruments. Why? Put simply, it’s more difficult to predict events the further out into the future you go; investors need to be compenstated for this additional risk with higher yields. This relationship produces a positive sloping yield curve.

When looking at a government bond yield curve (like Bunds or Treasuries), various assessments about the state of the economy can be made at any point in time. Are short-end rates rising rapidly? This could mean that the Fed is signaling a rate hike is coming soon. Or, that there are funding concerns for the federal government. Have long-end rates dropped sharply? This could mean that growth expectations are falling. Or, it could mean that sovereign credit risk is receding. Context obviously matters.

Does the US Treasury Yield Curve Inversion Matter?

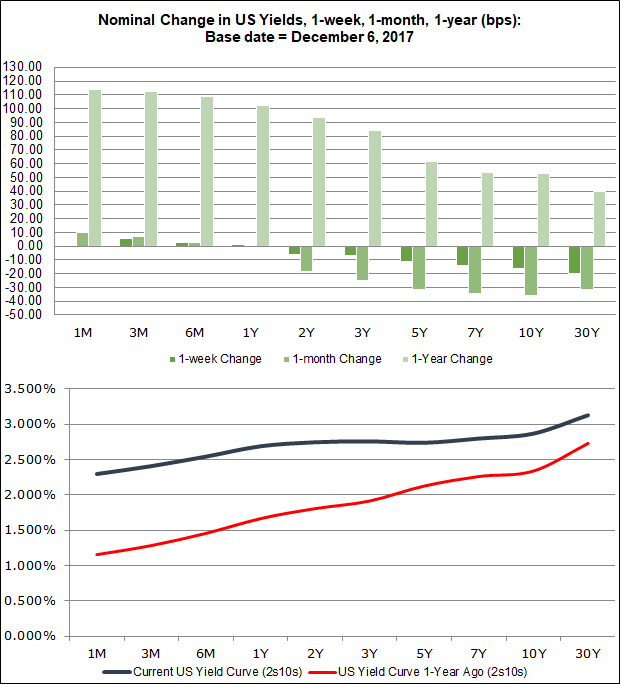
It’s true that part of the US Treasury yield curve started to invert this week. We’ve seen both 2- and 3-year yields rise above 5-year yields. The “flattening” of the yield curve over the past year, predating this week’s inversion, is rather apparent when comparing the shape of the yield curve today relative to that from last December:

US Treasury Yield Curve (December 6, 2018) (Table 1)

Why Does the US Yield Curve Inversion Matter?

The knee-jerk reaction by many market participants, but mainly financial news media, has been to declare the inversion of the US Treasury yield curve as a harbinger of a forthcoming recession. The stats speak for themselves: yield curve inversions predict recessions (more on this shortly).

While there are certainly good reasons for concern – the US-China trade war, the fading impulse of fiscal stimulus from the Trump tax plan, a housing market that is looking weaker amid higher interes rates – its best to take a step back.

Let’s Ask the Professor

Amid all of the talk about the US Treasury yield curve inverting this week, the Duke University finance professor who is the godfather of yield curve analysis (his 1986 dissertation explored the concept of using the yield curve to forecast recessions) gave an interview to NPR (which can be listened to here). Professor Campbell Harvey made a few key points regarding the yield curve inversion which traders should take to heart:

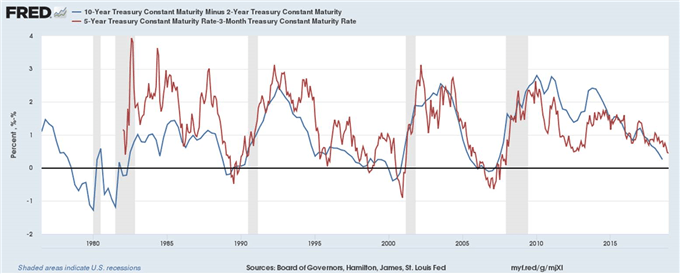
1) The model Harvey used initially looked at the 3-month, 5-year spread (3m5s), and conventional wisdom points to the 2-year, 10-year (2s10s) spread as the yield curve; all of the concern this week about the 2-year, 5-year (2s5s) and 3-year, 5-year (3s5s) spreads inverting did not interest him, given that they as shorter-maturity instruments didn’t qualify as “short-term” enough in his model;

US Treasury Yield Curves: 3m5s and 2s10 (1975 to 2018) (Chart 1)

Why Does the US Yield Curve Inversion Matter?

2) The yield curve inversions being discussed now are not significant. According to his research, the yield curve needs to invert for at least one full quarter (or three months) in order to give a true predictive signal (since the 1960s, a full quarter of inversion has predicted every recession correctly);

3) Regardless of the 3m5s and 2s10s curves not inverting this week, Harvey still believes the period of aggressive flattening is significant and it the yield curve is signaling slower economic growth for the US, but not yet a recession.

Read more: US Dollar Unable to Rally Even as Risk Appetite Erodes

— Written by Christopher Vecchio, CFA, Senior Currency Strategist

To contact Christopher Vecchio, e-mailcvecchio@dailyfx.com

Follow him on Twitter at@CVecchioFX

View our long-term forecasts with theDailyFX Trading Guides


Source link


https://ift.tt/2BXy61W

jeudi 6 décembre 2018

Post-BoC Rally Triggers RSI Breakout


Canadian Dollar Talking Points

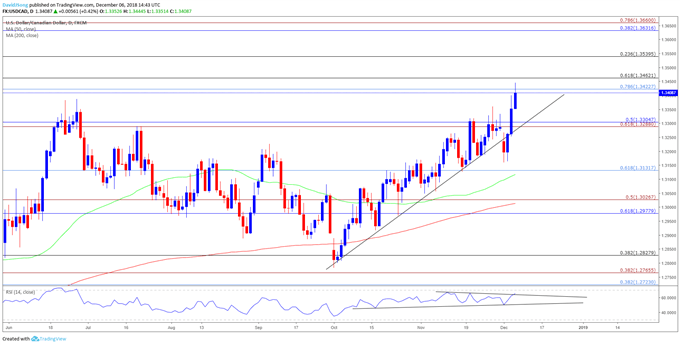
USD/CAD climbs to a fresh year-high (1.3445) as the Bank of Canada (BoC) adopts a less-hawkish tone ahead of 2019, and recent price action keeps the topside targets on the radar as the Relative Strength Index (RSI) flashes a bullish signal.

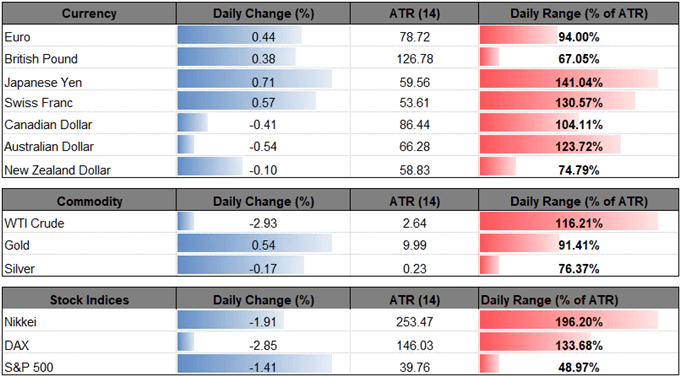
Image of daily change for major currencies

USD/CAD Rate Forecast: Post-BoC Rally Triggers RSI Breakout

Image of daily change for usdcad rate

The Canadian dollar may continue to depreciate against its U.S. counterpart as the BoC sees ‘additional room for non-inflationary growth,’ and it seems as though the central bank will stay on the sidelines at the next meeting on January 9 as inflation ‘is expected to ease in coming months by more than the Bank had previously forecast.’

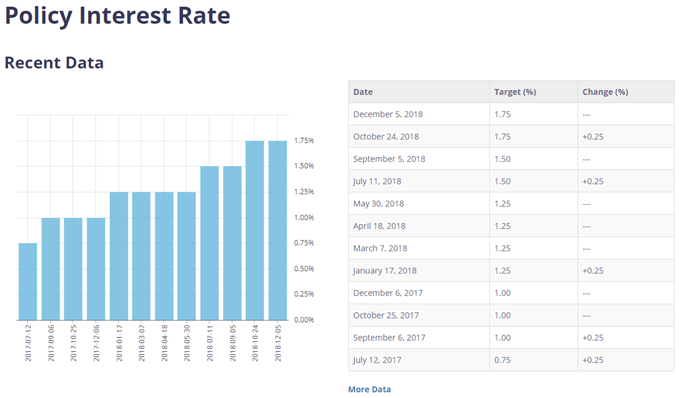
Image of bank of canada interest rate decisions

Keep in mind, the BoC may continue to prepare Canadian households and businesses for higher borrowing-costs as Governor Stephen Poloz warns that central bank is ‘looking to move interest rates to a neutral level,’ but the fresh remarks suggest the Governing Council will take a more gradual approach in normalizing monetary policy after delivering three 25bp rate-hikes in 2018.

With that said, the shift in the forward-guidance for monetary policy may continue to produce headwinds for the Canadian dollar especially as the Federal Reserve is widely expected to implement higher U.S. interest rates later this month, and USD/CAD may continue to appreciate ahead of Canada’s Employment report as the exchange rate carves a series of higher highs & lows.

At the same time, recent developments in the Relative Strength Index (RSI) highlights a similar dynamic as the oscillator breaks out of the bearish formation carried over from the previous month, with a break above 70 raising the risk for a further advance in USD/CAD as the bullish momentum gathers pace. Sign up and join DailyFX Currency Analyst David Song LIVE for an opportunity to discuss potential trade setups.

USD/CAD Daily Chart

Image of usdcad daily chart

  • Broader outlook for USD/CAD remains constructive despite the dip below trendline support as the exchange rate clears the June-high (1.3386), with the recent series of higher highs & lows raising the risk for a larger advance especially as the Relative Strength Index (RSI) appears to be breaking out of a triangle/wedge formation.
  • Nevertheless, need a break/close above the 1.3420 (78.6% retracement) 1.3460 (61.8% retracement) region to open up the 1.3540 (23.6% retracement) hurdle, with the next area of interest coming in around 1.3630 (38.2% retracement) to 1.3660 (78.6% expansion).

USD/CAD Rate Forecast: Post-BoC Rally Triggers RSI Breakout

Additional Trading Resources

Are you looking to improve your trading approach? Review the ‘Traits of a Successful Trader’ series on how to effectively use leverage along with other best practices that any trader can follow.

Want to know what other currency pairs the DailyFX team is watching? Download and review the Top Trading Opportunities for 2018.

— Written by David Song, Currency Analyst

Follow me on Twitter at @DavidJSong.


Source link


https://ift.tt/2RJtguM

mercredi 5 décembre 2018

USD/CAD Strength to Persist on Wait-and-See BoC


Trading the News: Bank of Canada (BoC) Interest Rate Decision

The Bank of Canada’s (BoC) last meeting for 2018 may do little to influence the near-term outlook for USD/CAD as the central bank is widely anticipated to keep the benchmark interest rate at 1.75%.

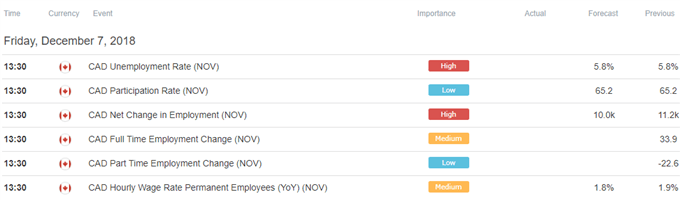
Image of DailyFX economic calendar

The BoC may revert back to a wait-and-see approach after delivering a 25bp rate-hike in October, and more of the same from the central bank may dampen the appeal of the Canadian dollar as the Governing Council pledges ‘to take into account how the economy is adjusting to higher interest rates, given the elevated level of household debt.’

In turn, the Canadian dollar may face a bearish reaction if the BoC merely attempt to buy time at the December meeting, with USD/CAD at risk of retracing the decline from earlier this week especially as the Federal Reserve is widely expected to implement a rate-hike later this month.

However, Governor Stephen Poloz & Co. may continue to prepare Canadian households and businesses for higher borrowing-costs as the ‘Governing Council agrees that the policy interest rate will need to rise to a neutral stance to achieve the inflation target,’ and a hawkish forward-guidance for monetary policy may boost the appeal of the Canadian dollar as the BoC sticks to its hiking-cycle. Sign up and join DailyFX Currency Analyst David Song LIVE for an opportunity to discuss potential trade setups!

Impact that the BoC rate decision has had on USD/CAD during the last meeting

Period

Data Released

Estimate

Actual

Pips Change

(1 Hour post event )

Pips Change

(End of Day post event)

OCT

2018

10/24/2018 14:00:00 GMT

1.75%

1.75%

-71

-27

October 2018 Bank of Canada (BoC) Interest Rate Decision

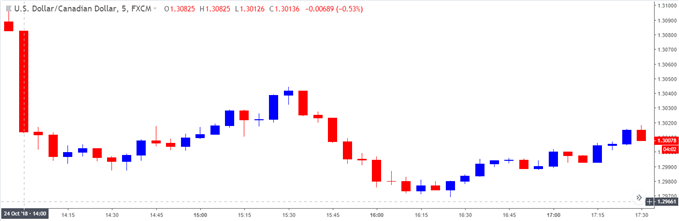
USD/CAD5-Minute Chart

Image of usdcad 5 minute chart

The Bank of Canada (BoC) implemented a 25bp rate-hike in October to push the benchmark interest rate to 1.75% from 1.50% the month prior, and it seems as though the central bank will continue to normalize monetary policy as ‘the Bank’s core measures of inflation all remain around 2 per cent, consistent with an economy that is operating at capacity.’ The BoC struck a more upbeat tone as ‘the new US-Mexico-Canada Agreement (USMCA) will reduce trade policy uncertainty in North America, which has been an important curb on business confidence and investment,’ and Governor Stephen Poloz & Co. may continue to prepare Canadian households and businesses for higher borrowing-costs as the ‘Governing Council agrees that the policy interest rate will need to rise to a neutral stance to achieve the inflation target.’

The Canadian dollar gained ground following the hawkish rate-hike, with USD/CAD quickly pulling back ahead of the 1.3100 region to end the day at 1.3056. Review the DailyFX Advanced Guide for Trading the News to learn our 8 step strategy.

USD/CAD Daily Chart

Image of usdcad daily chart

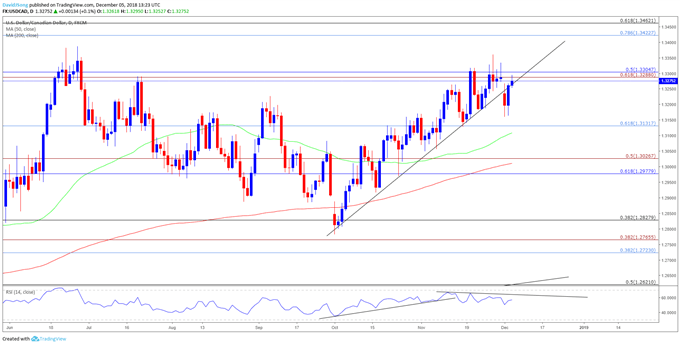
  • The advance from the October-low (1.2782) appears to have stalled ahead of the 2018-high (1.3386), with USD/CAD at risk of facing a near-term pullback as both price and the Relative Strength Index (RSI) snap the bullish formations during the same period.
  • Lack of momentum to hold above the 1.3290 (61.8% expansion) to 1.3310 (50% retracement) region may spur a move back towards 1.3130 (61.8% retracement), with a break/close below the stated region opening up the next downside area of interest around 1.2980 (61.8% retracement) to 1.3030 (50% expansion).

Additional Trading Resources

New to the currency market? Want a better understanding of the different approaches for trading? Start by downloading and reviewing the DailyFX Beginners Guide.

Are you looking to improve your trading approach? Review the ‘Traits of a Successful Trader’ series on how to effectively use leverage along with other best practices that any trader can follow.

— Written by David Song, Currency Analyst

Follow me on Twitter at @DavidJSong.


Source link


https://ift.tt/2Qidmur

mardi 4 décembre 2018

EUR/USD Nears Trend-Line as US Dollar Bounces from Fibonacci Support


EUR/USD, US Dollar Talking Points:

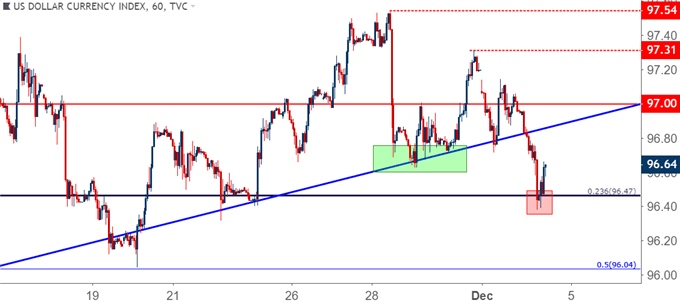
– The US Dollar has broken-below the bullish trend-line that’s been at work for the past two months, and a bit of support has shown up around the familiar Fibonacci level of 96.47. This is the 23.6% retracement of the 2011-2017 major move in the US Dollar and had last come into play two weeks ago. This has helped EUR/USD to push above the 1.1400 level after failing there last week, and this extends a pattern of higher-highs and lows in the pair.

– Tomorrow is a market holiday as US markets are closed for an official day of mourning to mark the passing of former US President, George H.W. Bush. The Jerome Powell semi-annual Humphrey Hawkins testimony has been cancelled, and this comes after his comments last week provided a strong boost to the risk trade.

– DailyFX Forecasts on a variety of currencies such as the US Dollar or the Euro are available from the DailyFX Trading Guides page. If you’re looking to improve your trading approach, check out Traits of Successful Traders. And if you’re looking for an introductory primer to the Forex market, check out our New to FX Guide.

Do you want to see how retail traders are currently trading the US Dollar? Check out our IG Client Sentiment Indicator.

US Dollar Pulls Back, US Markets Closed Tomorrow, Powell Testimony Postponed

This week’s economic calendar may have caught a bit of relief after Jerome Powell’s semi-annual Humphrey Hawkins testimony was postponed. Tomorrow, US markets will be closed for an official day of mourning for former US President, George H.W. Bush; and with D.C. out of the office, Chair Powell’s speech has postponed to a yet-to-be-named date. This comes at a key time as Chair Powell’s comments last week provided a quick and strong boost to equity prices.

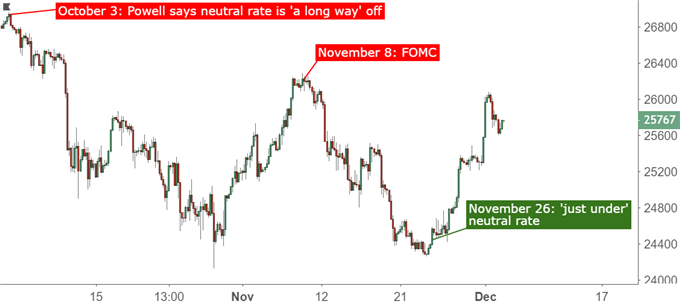
Last week saw a shift in the language of the Fed Chair, and this helped to provide a sense of support to equities after what had become a troubling prior seven weeks of price action. US stocks turned in early-October after Chair Powell opined that the Fed was ‘a long way’ from the neutral rate, which is the theoretical interest rate at the bank in which policy is neither stimulative nor restrictive. Those comments in early-October were heavily inferred to mean that the Fed had plans for even more interest rate hikes in 2019, and in short order the bullish breakouts that drove equity prices higher throughout Q3 were taking a bearish turn.

But in Mr. Powell’s comments last week, his language around the bank’s proximity to the neutral rate was a bit less threatening, as he opined that the FOMC was ‘just under’ this rate. That helped equity prices to fly-higher, and that strength extended into the end of the week, and into the G20 meeting in Argentina.

Dow Jones Four-Hour Price Chart

DJIA Dow Jones Four Hour price chart

Over the weekend, another bullish drive availed itself around the China-US trade war. This was covered by our own Justin McQueen yesterday in his article entitled, S&P 500 and Dow Jones Outlook: US-China Trade War Truce Sparks Rally.

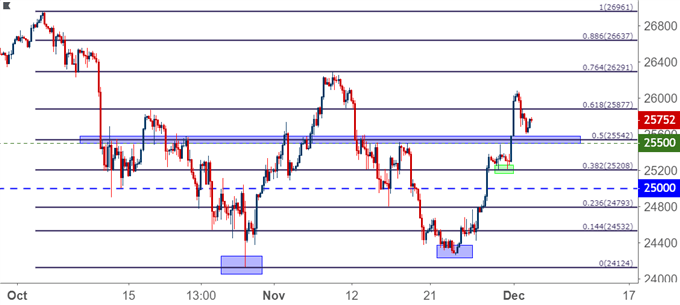
That led to a quick gap-higher as futures opened for trade on Sunday, and prices pushed above the 26k level temporarily ahead of the US open. When US equity markets did open for the day, that pullback extended; but thus far buyers have held-up prices above the key area on the chart around 25,500. On the hourly chart below, a series of lower-lows and lower highs remains in short-term price action. The key for the next couple of days would be to see support set-in so that higher-highs and higher-lows begin to show again; and that could open the door to bullish continuation strategies.

Dow Jones Four-Hour Price Chart

DJIA Dow Jones Four Hour Price Chart

EUR/USD Climbs Above 1.1400 as the US Dollar Takes a Bearish Turn

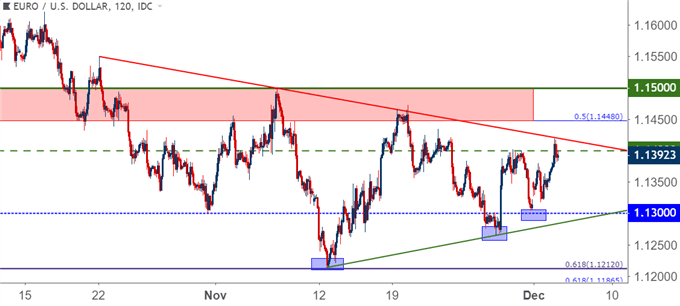
In yesterday’s article, I looked at the higher-lows that have built in EUR/USD over the past few weeks, and this was extended into December after buyers showed support right around the low of the weekend gap in yesterday’s session. That’s led into a fresh weekly high as bulls have pushed above the same 1.1400 level that they shied away from last Thursday; and prices are now nearing a bearish trend-line that can be found by connecting the October 22nd swing-high to the November high, the projection of which helped to hold resistance later in the month.

EUR/USD Two-Hour Price Chart: Higher-Highs Approaching Trend-Line Resistance

eurusd eur/usd two hour price chart

US Dollar Bounces From Fibonacci Support

The US Dollar is testing below the bullish trend-line again as the lower-highs looked at yesterday have extended into fresh lower-lows. The US Dollar is working on fresh weekly lows after sellers pushed prices down to the 96.47 Fibonacci level, making a concerted to drive prices below a trend-line that’s been in-play for the past two months.

US Dollar Hourly Price Chart

us dollar usd hourly price chart

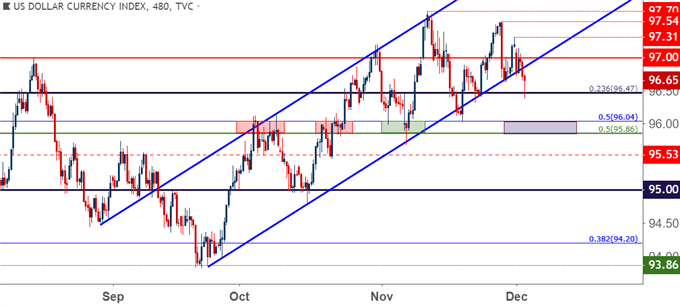
The next major area of support interest on the pair is the zone that helped to arrest the lows three weeks ago, and this runs around the 96.04 level which is the 50% marker of the 2017-2018 down-trend in the currency. A bit deeper, around 95.86 is another level of interest, as this is the 50% mid-point of the 2001-2008 major move in DXY. This zone came in to help set resistance on two separate occasions in October before buyers were finally able to push through, and once that happened the same price zone helped to set support in early-November.

US Dollar Eight-Hour Price Chart

us dollar usd eight hour price chart

GBP/USD Rallies After the EU Dangles ‘Remain-Route Carrot’ in Front of the UK

This was discussed at length earlier this morning by my colleague, Nick Cawley, in his article entitled Brexit News: Sterling (GBP) Soars After EU Dangles Brexit Carrot.

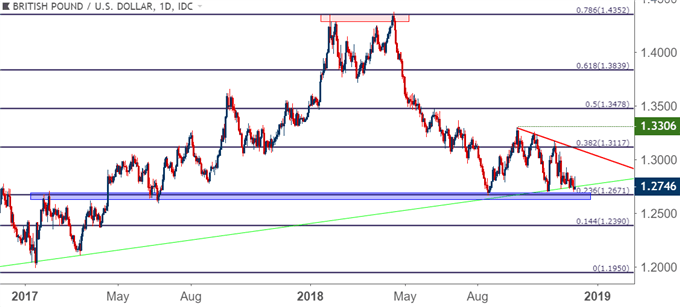
This led to a quick move of strength in GBP/USD after sellers shied away from the three-month low around yesterday’s open. This extends a rather difficult period for the currency, as GBP/USD has been working with back-and-forth price action for the better part of the past three months. The support side of that churn has a number of key levels sitting underneath and bears at this point appear uninterested in testing below.

But the challenge remains: Will GBP/USD be able to elicit fresh sellers upon breaks of this support? And if so, for how long might that move extend? This makes for a rather complicated backdrop, as there is little optimism currently showing around the matter, yet sellers haven’t been able to make much ground below 1.2700 so far this year. As Martin Essex discussed, the upcoming House of Commons vote appears unlikely to pass, and that failure could bring on four different scenarios, none of which appear to be very positive for the Pound.

GBP/USD Daily Price Chart

gbpusd gbp/usd daily price chart

NZD/USD Pulls Back From Fresh Five-Month Highs

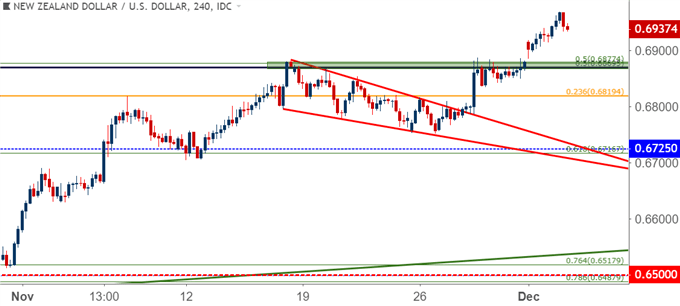
On the side of USD-weakness, I’ve been following NZD/USD since October as the pair had started to build in a base of support even when the US Dollar was trending up to fresh yearly highs. As phases of USD-weakness have started to price-in from those early November highs, prices in NZD/USD have jumped above a number of resistance levels, making a fast approach towards the .7000 big figure.

At this point, a prior area of resistance offers higher-low support potential, and this takes place around a confluent area on the chart with two different Fibonacci levels in close proximity. The price of .6877 is the 50% marker of the 2015-2017 major move, and the level of .6871 is the 50% marker of the 2009-2011 move. This zone helped to hold the highs on two separate occasions last month; and price action this week gapped above this level, leaving a bit of unfilled gap on the chart. This becomes an area of interest for higher-low support for bullish continuation strategies in NZD/USD.

NZD/USD Four-Hour Price Chart

nzdusd nzd/usd four hour price chart

Chart prepared by James Stanley

To read more:

Are you looking for longer-term analysis on the U.S. Dollar? Our DailyFX Forecasts for Q4 have a section for each major currency, and we also offer a plethora of resources on USD-pairs such as EUR/USD, GBP/USD, USD/JPY, AUD/USD. Traders can also stay up with near-term positioning via our IG Client Sentiment Indicator.

Forex Trading Resources

DailyFX offers a plethora of tools, indicators and resources to help traders. For those looking for trading ideas, our IG Client Sentiment shows the positioning of retail traders with actual live trades and positions. Our trading guides bring our DailyFX Quarterly Forecasts and our Top Trading Opportunities; and our real-time news feed has intra-day interactions from the DailyFX team. And if you’re looking for real-time analysis, our DailyFX Webinars offer numerous sessions each week in which you can see how and why we’re looking at what we’re looking at.

If you’re looking for educational information, our New to FX guide is there to help new(er) traders while our Traits of Successful Traders research is built to help sharpen the skill set by focusing on risk and trade management.

— Written by James Stanley, Strategist for DailyFX.com

Contact and follow James on Twitter: @JStanleyFX


Source link


https://ift.tt/2RuswJH

lundi 3 décembre 2018

US Dollar Holds Trend-Line Support Ahead of Powell, US NFP’s


US Dollar Holds Trend-Line Support Ahead of Powell, US NFP’s

US Dollar Talking Points:

– US Equities are starting December in a very bullish way, gapping-higher to start the final month of the year following some positive comments at the G20 meeting this weekend. The potential for calm developing around trade tariffs has bulls on the bid, and the Dow Jones Industrial Average is making a run at 26k after opening last week around 24,300.

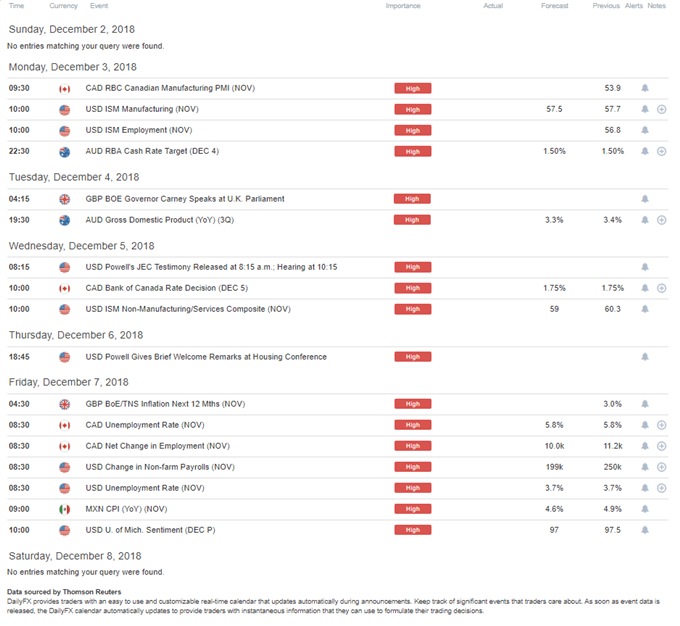
– FX markets are moving rather slowly in comparison to equities, and there may be a bit of congestion to work through in the early-portion of this week. The latter portion of the week, however, brings a series of US drivers that can continue to push the Dollar. Wednesday sees American financial markets close for an official day of mourning for the death of former US President, George HW Bush. This is also the start of Jerome Powell’s semi-annual Humphrey Hawkins testimony, in which he’ll provide testimony on Wednesday morning before fielding questions from Congress. Powell speaks to the House on Thursday, and Friday brings Non-Farm Payrolls; so the US Dollar will likely remain in-focus into the end of this week’s trade.

– DailyFX Forecasts on a variety of currencies such as the US Dollar or the Euro are available from the DailyFX Trading Guides page. If you’re looking to improve your trading approach, check out Traits of Successful Traders. And if you’re looking for an introductory primer to the Forex market, check out our New to FX Guide.

Do you want to see how retail traders are currently trading the US Dollar? Check out our IG Client Sentiment Indicator.

A Bullish Weekend for Stocks

Opening December price action brings a theme of optimism, as news this weekend of thawing relations between Beijing and the United States have helped to propel equity prices higher. US equities are starting the month with a big move of strength following this weekend’s developments at G20. Both President Trump and President Xi agreed to hold off on tariff increases, signaling a potential pivot in a theme that’s only worsened over the past couple of months. This is a market pressure point finding calm after another similar instance took place last week around rate hikes out of the United States; and this came from testimony from FOMC Chair Jerome Powell.

Mr. Powell will remain in the news this week as Wednesday and Thursday bring the semi-annual Humphrey Hawkins testimony in-front of Congress. This will begin with testimony from the Fed Chiar, followed by questions from Congress. On Wednesday, Mr. Powell speaks to the Senate Finance Committee and on Thursday he’s in front of the House Financial Services Committee. This leads into the Friday release of Non-Farm Payrolls, making for an especially busy economic calendar in the latter-portion of the week for US traders.

Also of concern – American financial markets will be closed on Wednesday for an official day of mourning for former US President, George H.W. Bush. This includes the New York Stock Exchange, Nasdaq equities and options markets, CME Group’s equity and rates markets and the CBOE’s Global Markets exchanges. This can lead to especially volatile over-the-counter markets on Wednesday to go along with the potential for large moves around the US open on Thursday.

DailyFX Economic Calendar: High-Impact for the Week of December 3, 2018

DailyFX Economic Calendar

US Dollar Drops at Open, Finds Support Around Trend-Line; Unfilled-Gap Remains

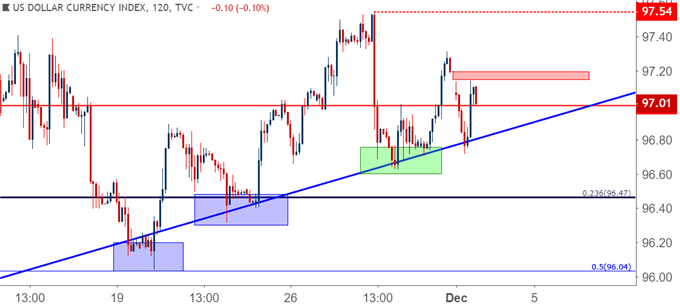
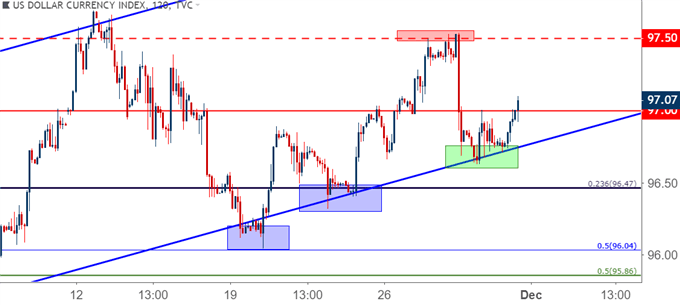
Going along with that risk-on tone after the Sunday open, the US Dollar gapped lower and continued to sell-off through the Asian session. Prices trickled back-down to the bullish trend-line that had come back into play again last week, where a bit of a bounce has started. That bounce may have a bit more room to run, as there remains a portion of unfilled-gap from this weekend’s open.

US Dollar Two-Hour Price Chart: Unfilled Weekend Gap Remains

US Dollar two hour price chart

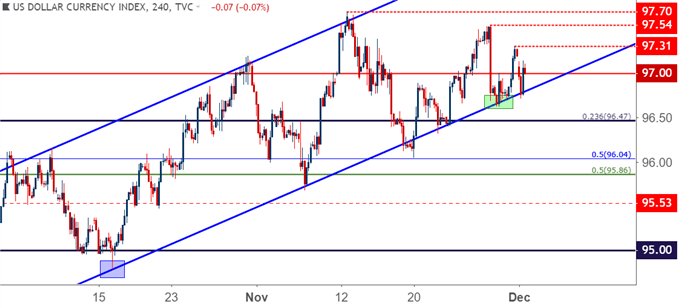
The big question is whether bulls can challenge swing-highs around 97.30 and 97.50, the latter of which was the lower-high that came into play around Chair Powell’s testimony last week. If prices do test above this level, the door for bullish continuation remains open with targets set for a test of the yearly high around 97.70. But – if buyers fail to test through, the door may soon be opening for USD-weakness strategies as a series of lower-highs continues to build in.

US Dollar Daily Price Chart: Are Dollar Bulls Running Out of Steam?

us dollar usd four hour price chart

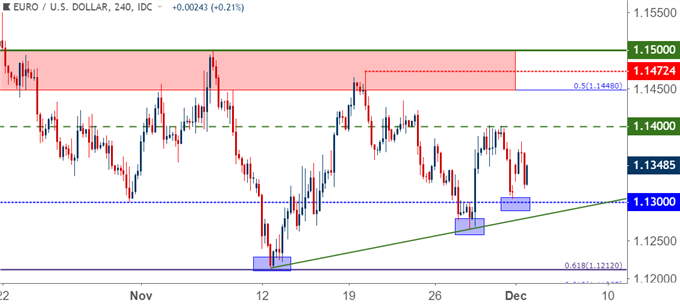
EUR/USD Fills Gap As Higher-Lows Continue to Build

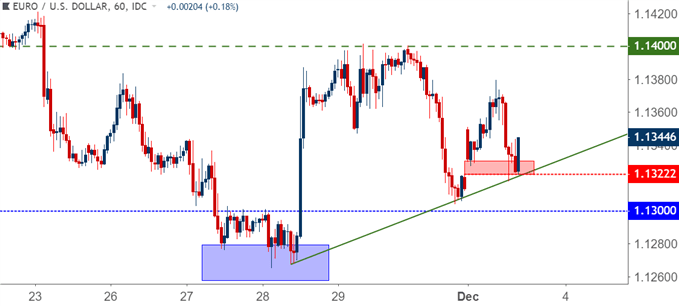
Going along with that gap-lower in the US Dollar was a gap-higher in EUR/USD, as the pair opened Sunday trade at the 1.1350 handle, quickly dropping by 20 pips before buyers stepped-in to push prices back-up to 1.1375. Around the European open is when sellers stepped up to the plate, and EURUSD price action quickly filled whatever unfilled gap was remaining; and prices now appear to be trying to cauterize support around the 1.1325 area on the chart.

EUR/USD Hourly Price Chart

eurusd eur/usd hourly price chart

The big question around the Euro at the moment is whether a bigger-picture reversal setup might be brewing. The final three weeks of November saw a build of higher-lows and this comes despite a plethora of reasons for sellers to continue to push. They didn’t, and those higher-lows have built-in, begging the question as to whether the pair has much short-side potential left without some additional motivation brought upon by the developing scenario around Italy and the European Commission.

Key for this theme will be defense of last week’s swing-low around 1.1266. This came-in ahead of that Powell speech, after which EUR/USD jumped up to the 1.1400 handle, at which point bulls were simply unable to make more ground. Since then, we’ve had a hold of higher-low support; and if we see continued defense of the lows, a deeper move of strength may soon be in store.

EUR/USD Four-Hour Price Chart

eurusd eur/usd four hour price chart

Chart prepared by James Stanley

To read more:

Are you looking for longer-term analysis on the U.S. Dollar? Our DailyFX Forecasts for Q4 have a section for each major currency, and we also offer a plethora of resources on USD-pairs such as EUR/USD, GBP/USD, USD/JPY, AUD/USD. Traders can also stay up with near-term positioning via our IG Client Sentiment Indicator.

Forex Trading Resources

DailyFX offers a plethora of tools, indicators and resources to help traders. For those looking for trading ideas, our IG Client Sentiment shows the positioning of retail traders with actual live trades and positions. Our trading guides bring our DailyFX Quarterly Forecasts and our Top Trading Opportunities; and our real-time news feed has intra-day interactions from the DailyFX team. And if you’re looking for real-time analysis, our DailyFX Webinars offer numerous sessions each week in which you can see how and why we’re looking at what we’re looking at.

If you’re looking for educational information, our New to FX guide is there to help new(er) traders while our Traits of Successful Traders research is built to help sharpen the skill set by focusing on risk and trade management.

— Written by James Stanley, Strategist for DailyFX.com

Contact and follow James on Twitter: @JStanleyFX


Source link


https://ift.tt/2RuQBQD

dimanche 2 décembre 2018

S&P 500, DAX, Nikkei Eye G-20 Aftermath. FTSE Awaits Brexit Vote


SPX

Talking Points:

  • A truce in the US-China trade war will offer stability into the new year
  • DAX will look to German automakers’ trip to the White House
  • FTSE will look to Brexit as Prime Minister May looks to drum up enough support to pass her deal

A Dovish Fed Bolstered US Equities

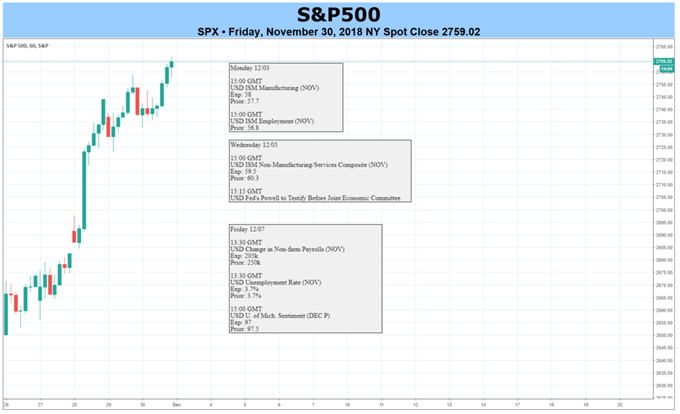
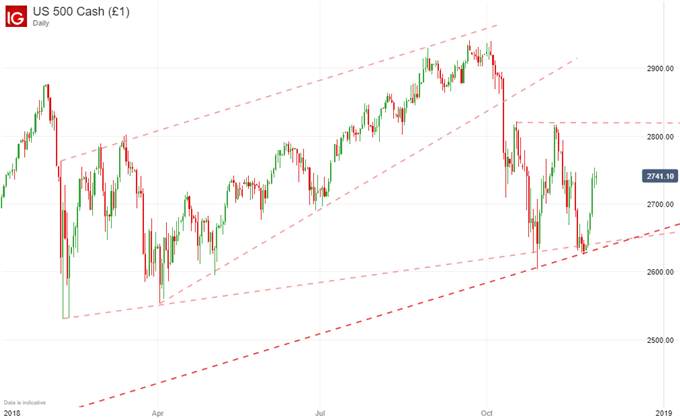
US equities were driven higher last week on the back of seemingly dovish comments from Federal Reserve Chairman Jerome Powell. The Dow and S&P 500 closed the week and month higher, while the NASDAQ posted a third consecutive month of decline despite a strong week itself. Despite three months of turbulence, all three indices are again in the black for 2018 as we enter December with many hoping for a Santa Claus rally. The case for a Christmas miracle was bolstered after the G20 summit concluded in a productive manner and any escalations in the US-China trade war were paused.

S&P 500 Price Chart (1) Daily, Year-to-Date

S&P 500, DAX, Nikkei Eye G-20 Aftermath. FTSE Awaits Brexit Vote

Learn about the differences between the Dow, Nasdaq, and S&P 500.

G20 Aftermath to Drive Global Equities in the Week Ahead

Leaders from 38 nations across the globe travelled to Buenos Aires, Argentina on Friday to discuss the future of work, infrastructure for development and a sustainable food future. While noble and deserving causes, the scheduled discussion was overshadowed by trade talks between leaders from the world’s largest economies. The most anticipated event was a sit-down dinner between President Donald Trump and Chinese President Xi Jinping. The two heads of state have clashed over trade as their nations remain locked in an ever-growing trade war.

Read up on the history of trade wars to gain context for the US-China trade war with A Brief History of Trade Wars.

That said, market expectations as the meeting approached were mixed. Many believed President Trump would be unwilling to make a deal with China and subsequently increase already enacted tariffs. Instead, it was reported the two leaders had constructive conversation and agreed to pause any further tariffs until January 1st. The truce will sooth some fears for global equity markets and US indices in particular. Thus, barring any new trade war fronts, expect a renewed sense of stability in the week ahead as markets take advantage of the relative certainty and attempt to work out the next steps for the US-China trade war.

Nikkei 225 Looks to G20 Aftermath and to Avoid US Auto Tariffs

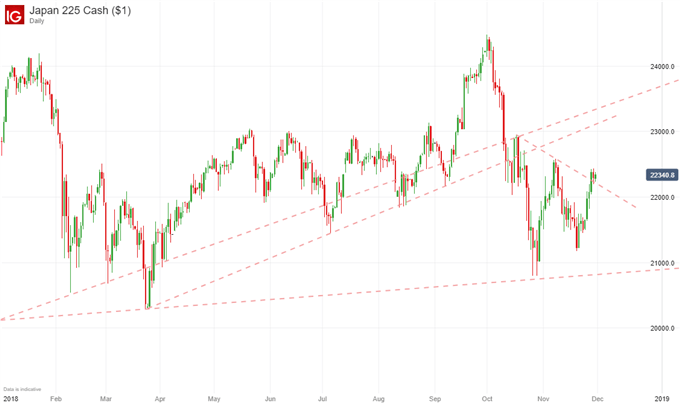
The trade war truce will also serve to aid the Nikkei in the week ahead. As a major economy, many Japanese corporations noted the impact of the trade war between two of its largest trading partners. While the Trump-Xi dinner may boost morale for some, the risk of US auto tariffs on Japan remains. President Trump and Prime Minister Shinzo Abe discussed trade and the G20 but also fell short of any concrete developments. In the past, the Trump administration has weighed auto tariffs on Japan but has not yet pursued the option.

Nikkei 225 Price Chart (2) Daily, Year-to-Date

S&P 500, DAX, Nikkei Eye G-20 Aftermath. FTSE Awaits Brexit Vote

German Automakers Plead Their Case

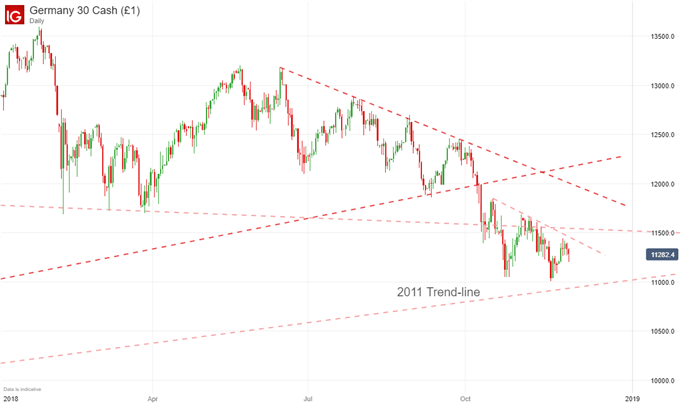
Similarly, the DAX will be focused on autos in the week ahead. On Wednesday, German automakers BMW, Mercedes and Volkswagen will travel to the White House. The meeting will likely cover the possibility of auto tariffs on the EU, another possible direction of the Trump administration’s effort to rebalance its global trade deficit.

A concrete agreement to hold off on tariffs would spur the DAX higher. Conversely, a pledge from the automakers to increase manufacturing in the US could siphon some gains to the S&P 500. Either way, the event will be critically important for the global auto industry and trade relations between the US and EU.

DAX Price Chart (3) Daily, Year-to-Date

S&P 500, DAX, Nikkei Eye G-20 Aftermath. FTSE Awaits Brexit Vote

Learn how to trade the DAX.

FTSE and Brexit, Name a More Iconic Duo

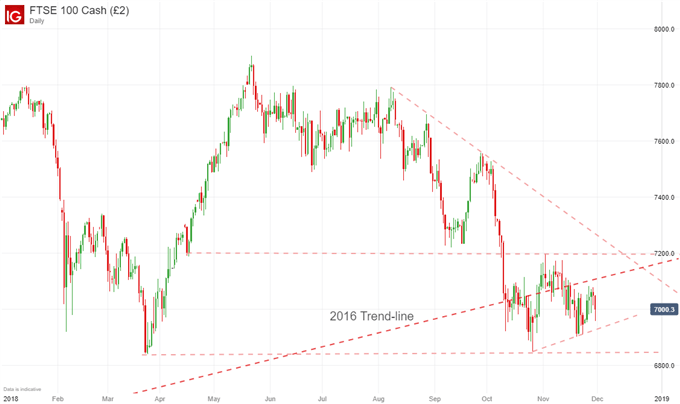
Finally, the FTSE will again look to Brexit. As Theresa May seeks to win over support for her deal this week, last week saw the BOE warn of the severely damaging economic impact should the UK drop out without a deal. Thus, if confidence in the PM is questioned, expect trouble for the FTSE. A decline in GBP/USD could offset greater FTSE losses but the exact impact will only be seen once the specifics of a Brexit breakdown or deal are made known.

FTSE 100 Price Chart (4) Daily, Year-to-Date

S&P 500, DAX, Nikkei Eye G-20 Aftermath. FTSE Awaits Brexit Vote

Sparse Data in the Week Ahead

The week ahead will be rather quiet from a data perspective, especially in comparison to the whirlwind of central bank press releases last week. US manufacturing will be a figure to watch on Monday as well as Fed Chairman Powell’s address to the Joint Economic Committee on Wednesday.

See the other economic events in the week ahead with our Economic Calendar.

–Written by Peter Hanks, Junior Analyst for DailyFX.com

Contact Peter on Twitter at @PeterHanksFX

DailyFX forecasts on a variety of currencies such as the US Dollar or the Yen are available from the DailyFX Trading Guides page. If you’re looking to improve your trading approach, check out Traits of Successful Traders. And if you’re looking for an introduction to the Forex market, check out our New to FX Guide.

Other Weekly Fundamental Forecast:

Japanese Yen Forecast – USD/JPY Rate Vulnerable to Less-Hawkish Fed Testimony

Australian Dollar Forecast – Australian Dollar Looks To Trump, Xi In Argentina, RBA Policy Meet

Oil Forecast – Crude Books Worst Month in 10yrs, Outlook Turns Dour Pre-OPEC, G20

Canadian Dollar Forecast – CAD Bracing for Volatility: BoC Hold, Jobs Report, OPEC Oil Cuts?

British Pound Forecast – Current Brexit Deal Won’t Pass Through UK Parliament

US Dollar Forecast – US Dollar May Rise on Economic Data Flow, Powell Testimony

Gold Forecast – Dovish Fed and US-China Deal Needed for Topside Breakout

Equities Forecast – S&P 500, DAX, Nikkei Eye G-20 Aftermath. FTSE Awaits Brexit Vote


Source link


https://ift.tt/2Q8kw4B

samedi 1 décembre 2018

BoC Hold, Jobs Report, OPEC Oil Cuts?


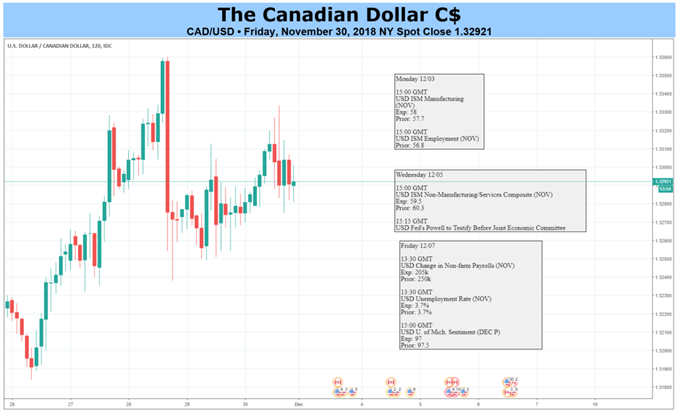
CAD/USD

Canadian Dollar Fundamental Forecast: Neutral

  • Canadian Dollar about two percent weaker against USD since last BoC rate decision
  • December’s rate hold may set the pace for next hike to come, potentially boosting CAD
  • Canadian jobs report may disappoint, draining CAD. Can OPEC reignite crude oil?

Have a question about what’s in store for Canadian Dollar next week? Join a DailyFX Trading Q&A Webinarto ask it live!

The Canadian Dollar continued being pressure against the US Dollar as we headed towards the end of the week. This has generally been the trend since October amidst the backdrop of fading near-term Bank of Canada rate hike expectations and a slump in crude oil prices. The former represents the main appeal of a currency while the latter is a key source of revenue for Canada.

Likely, the main event for the Loonie ahead may be the last BoC rate decision of 2018. This event is arguably one of the key reasons why CAD has been under pressure since the central bank last raised rates in October. About a month ago, the markets were roughly pricing in a 30 percent chance of another hike in December. Those are now at zero, aiding to send USD/CAD about 2% higher since then.

Since markets are forward looking, attention will turn to the BoC’s guidance to gauge when the next hike could be expected. This is because policymakers are looking to raise rates to a neutral level, similar to the Fed. Overnight index swaps are pricing in a 66% chance of a rate increase afterwards in January 2019. This is followed by a 32.1% chance of a subsequent one in April. We may get further clarification from a speech by BoC’s Governor Stephen Poloz the following day.

Signs that the central bank may pull the trigger on another hike soon would benefit the Canadian Dollar, but gains against the US Dollar could be difficult. Arguably, the Fed is more hawkish than its Canadian counterpart. But, this could leave the Australian and New Zealand Dollars considerably more vulnerable to a hawkish BoC. Their respective central banks may not even raise rates once in 2019.

After the BoC and a speech from its Governor, the Canadian Dollar awaits November’s local jobs report. Canadian economic news flow has generally been tending to underperform against economists’ expectations. Given a data dependent central bank, an unexpected negative surprise in the employment report risks sending CAD lower. As such, do also keep a close eye on the accompanying hourly wage numbers.

Finally, the 175th OPEC meeting is on the table. Speculation has been building of potential supply cuts on the horizon amidst the plunge in crude oil. But, this could be made difficult to achieve if Russia, a major non-OPEC producer, is not on the same page. With that in mind, the Canadian Dollar fundamental outlook will have to be neutral.

— Written by Daniel Dubrovsky, Junior Currency Analyst for DailyFX.com

To contact Daniel, use the comments section below or @ddubrovskyFX on Twitter

Other Weekly Fundamental Forecast:

Japanese Yen Forecast – USD/JPY Rate Vulnerable to Less-Hawkish Fed Testimony

Australian Dollar Forecast – Australian Dollar Looks To Trump, Xi In Argentina, RBA Policy Meet

Oil Forecast – Crude Books Worst Month in 10yrs, Outlook Turns Dour Pre-OPEC, G20


Source link


https://ift.tt/2Si5J3Q

vendredi 30 novembre 2018

EUR/USD Folds at 1.1400 as USD/CAD Makes Another Run at Resistance


EUR/USD Folds at 1.1400 as USD/CAD Makes Another Run at Resistance

EUR/USD, GBP/USD, USD/CAD Talking Points:

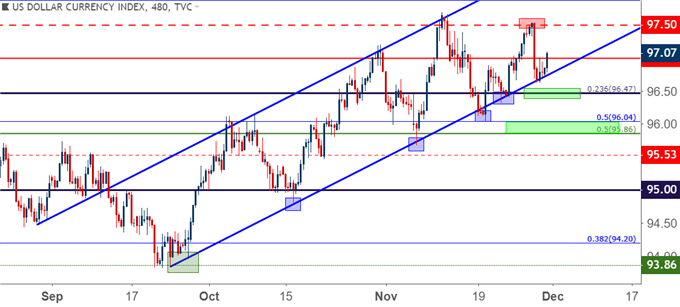
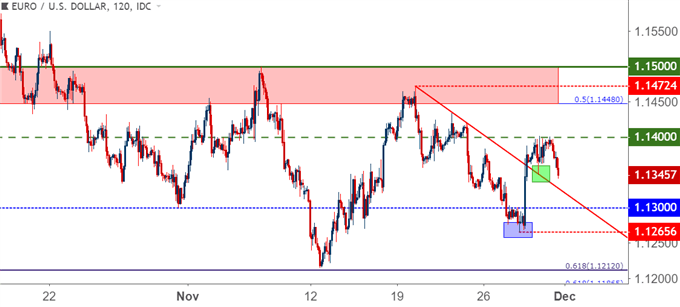
  • FX Market Trends caught a pullback this week as USD-strength abated following comments from FOMC Chair, Jerome Powell, on Wednesday. This helped the US Dollar to pullback from a lower-high at the 97.50 level, and support soon showed around a bullish trend-line that’s been at work over the past two months. This helped a bit of relief to show in beleaguered pairs such as EUR/USD and GBP/USD; and the big question at this point is whether that can last.
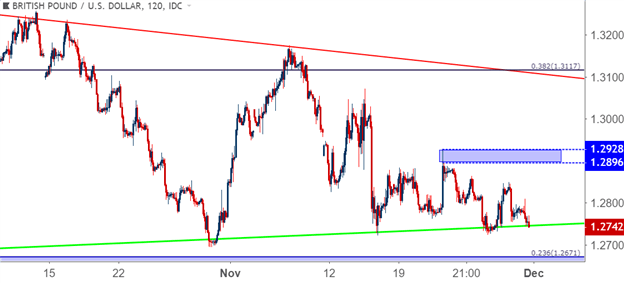
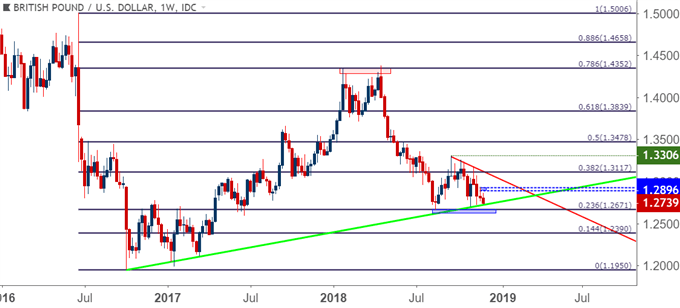
  • EUR/USD has found resistance at the 1.1400 handle while GBP/USD continues to display tendencies of a bear trap. Attractive short-side momentum in Cable has continued to be thwarted at higher-low support since a long-term trend-line came into play two weeks ago, and this complicates bearish continuation approaches in the pair going into what could become a pensive weekend of economic headlines.

Do you want to see how retail traders are currently trading the US Dollar? Check out our IG Client Sentiment Indicator.

US Dollar Trend-Line Support Holds Lows into G20

A bit of calm has shown over the US Dollar following the Wednesday fall, and this takes place as G20 is set to begin in Argentina. A number of issues remain of interest, and prices in DXY have continued to hold trend-line support following the earlier-week breakdown of US Dollar strength.

US Dollar Two-Hour Price Chart: Trend-Line Support Holds the Weekly Lows

us dollar usd two hour price chart

Chart prepared by James Stanley

On a bigger-picture basis, the operative question is whether the two-month trend is at risk following Jerome Powell’s comments earlier this week. A bearish response showed in the USD as Chair Powell had a softer tone towards the Fed’s proximity to the neutral rate; and this helped DXY to put in a lower-high at the 97.50 level following the early-November high at 97.70.

Below the trend channel are several interesting items for support potential. The price of 96.47 is the 23.6% Fibonacci retracement of the 2011-2017 major move. This helped to cauterize support in the latter-portion of last week, and a bit lower is another Fibonacci level at 96.04, as this is the 50% marker of the 2017-2018 bearish move. This is also the same price that helped to turn around a bearish two weeks ago, bringing bulls back into the market after price action retraced from that fresh yearly high. And just below that, helping to establish a zone of support potential, is another level of interest at 95.86. This is the 50% marker of the major move that spans from the years 2001-2008.

US Dollar Eight-Hour Price Chart

us dollar usd eight hour price chart

Chart prepared by James Stanley

Euro Bulls Fold at 1.1400 on EUR/USD

This was a focus chart in yesterday’s webinar, as the short-term bullish move in the pair following Powell’s comments on Wednesday was unable to continue beyond the 1.1400 level. This was fairly clear evidence of sellers using that bump to add or establish bearish exposure. The big question now is how motivated sellers might be after lower-high resistance showed up; and given the higher-low that came into play ahead of that Powell speech, this may be a difficult time to try to work short-side trend strategies on the pair.

As the December open nears, the resistance zone that’s been in play over the past month remains of interest. This area on the chart runs from 1.1448 up to 1.1500, and this zone has had a bearing on price action for pretty much the entirety of Q4 so far, first as support and for the past six weeks helping to set resistance.

EUR/USD Two-Hour Price Chart

eurusd eur/usd two hour price chart

Chart prepared by James Stanley

GBP/USD: Cable Bears Tested at Trend-Line

While GBP/USD was screaming with short-term volatility earlier this month, matters have calmed and prices appear to be digging into support offered via a trend-line projection. This trend-line can be found by connecting the October 2016 ‘flash crash’ low to the March 2017 swing low. For the past two weeks, this projection, shown in green on the below chart, has helped to set higher-lows in the pair.

GBP/USD Two-Hour Price Chart

EUR/USD Folds at 1.1400 as USD/CAD Makes Another Run at Resistance

Chart prepared by James Stanley

This is around a key zone of longer-term support; and just underneath current price action there is additional support potential. The yearly low came-in from the 23.6% Fibonacci retracement of the Brexit move. And since that came into play in mid-August, prices have been building into a series of higher-lows. This is partly why I had called this setup a bear trap earlier in the week; and there may be some of that potential remaining as bears shy away from re-tests of prior lows.

What could make this setup interesting for trends again is a break of the three-month pattern of back-and-forth price action. On the support side of the matter, prices may need some help from the headlines with more negative Brexit items; and given the pace of the past few months, that’s something that the trader would have to look at as a possibility.

GBP/USD Weekly Price Chart

gbpusd gbp/usd weekly price chart

Chart prepared by James Stanley

USD/CAD Poised for Another Test at the Yearly High: Can Bulls Break Through?

Going along with that bullish trend in the US Dollar over the past two months has been a strong and consistent topside move in USD/CAD.

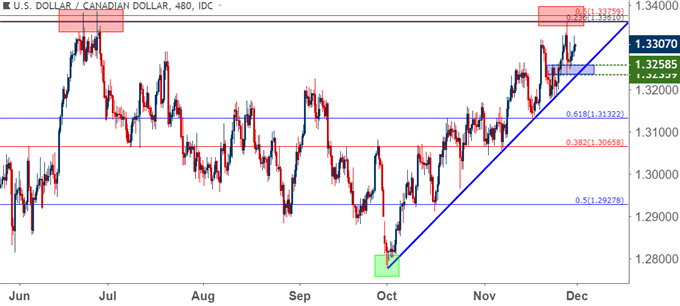
I started looking at the pair for bullish setups a couple of weeks ago as a confluent area of support came into play, and prices soon worked up to fresh five-month highs. That enthusiasm continued into this week as price action vaulted up to a key area of confluent chart resistance, as taken from two Fibonacci levels resting at 1.3361 and 1.3377. This is the same zone of prices that helped to set the yearly high on the pair in June; just before the pair double-topped and reversed by more than 500 pips over the following four months.

But early-October is when the pair tested the 1.2800 handle; and since then buyers have been in-charge.

USD/CAD Eight-Hour Price Chart: Back to Fibonacci Resistance After Five-Month Hiatus

usdcad usd/cad eight hour price chart

Chart prepared by James Stanley

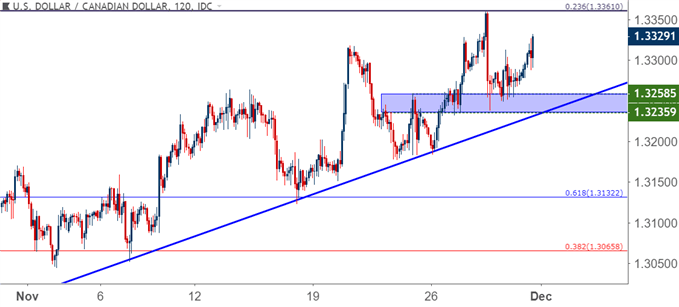
Earlier this week brought a trend-line test into the mix, and this was followed shortly after by a run up to 1.3361. After that resistance came into play, prices pulled back to set-higher low support, and it appears as though another test may soon be in the cards.

This can be a dangerous area to establish fresh bullish exposure, particularly given that this is a Friday with G20 going over the weekend. Traders may want to wait to see if another pullback shows up; and if buyers are able to punch through 1.3400 in short-order, the setup can be re-assessed to look for further potential around bullish continuation.

USD/CAD Two-Hour Price Chart

usdcad two hour price chart

Chart prepared by James Stanley

To read more:

Are you looking for longer-term analysis on the U.S. Dollar? Our DailyFX Forecasts for Q4 have a section for each major currency, and we also offer a plethora of resources on USD-pairs such as EUR/USD, GBP/USD, USD/JPY, AUD/USD. Traders can also stay up with near-term positioning via our IG Client Sentiment Indicator.

Forex Trading Resources

DailyFX offers a plethora of tools, indicators and resources to help traders. For those looking for trading ideas, our IG Client Sentiment shows the positioning of retail traders with actual live trades and positions. Our trading guides bring our DailyFX Quarterly Forecasts and our Top Trading Opportunities; and our real-time news feed has intra-day interactions from the DailyFX team. And if you’re looking for real-time analysis, our DailyFX Webinars offer numerous sessions each week in which you can see how and why we’re looking at what we’re looking at.

If you’re looking for educational information, our New to FX guide is there to help new(er) traders while our Traits of Successful Traders research is built to help sharpen the skill set by focusing on risk and trade management.

— Written by James Stanley, Strategist for DailyFX.com

Contact and follow James on Twitter: @JStanleyFX


Source link


https://ift.tt/2PdlDKK

jeudi 29 novembre 2018

AUD at Resistance, Russian Jawboning Lifts Oil


MARKET DEVELOPMENT – AUD at Resistance, Russian Jawboning Lifts Oil

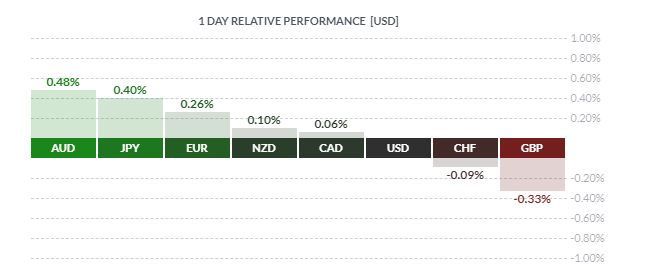
USD: Yet again Fed’s Powell dents the demand for the USD, reiterating his rather cautious stance, while also stating that interest rates are “just below” the estimates for the neutral rate. This in turn has seen rate hike expectations recede further with FFR futures pricing in 2 rate hikes by December 2019. The USD however, has pulled off worst levels with month-end demand underpinning. Of note, investment bank FX rebalancing point towards USD buying vs major counterparts.

EUR / GBP: The Euro largely unfazed by the dip in German inflation, which does not bode well for Eurozone inflation. On what has been a relatively quiet session on the Italian and Brexit front, the typical month-end buying in EURGBP has been the driver today, as the cross mad a break above 0.89.However, EURGBP did see a slight pullback as EURUSD failed to get a foothold above 1.14.

AUD: The Australian Dollar is back at familiar resistance with 0.7335-40 curbing further upside. As a reminder, previous rejection took AUDUSD back towards 0.72. Focus for Aussie traders will be on the developments regarding trade between the US and China at the G20 summit. If indeed, there are positive developments, this could see AUD at 0.74, while the 200DMA resides at 0.7420.

SEK: Big miss on Swedish GDP sees EURSEK above 10.30. The quarterly rate contracted 0.2%, taking the yearly rate to 1.6% below the expected 2.3%. Now while this may not be enough to deter the Riksbank from raising rates at the December 20th meeting, it does however, provide some doubts, while it also increases the importance of the inflation report, scheduled for December 12th.

Crude Oil: Some rather timely Russian Jawboning has reversed the fortunes for oil prices marginally with Brent reclaiming the $60/bbl mark. As I have mentioned previously, everyone has their price, and a move below $60 has prompted increased talk from Russian sources that they would be willing to take part in OPEC production cuts. The question on investors mind’s will be the size of the cut.

AUD at Resistance, Russian Jawboning Lifts Oil - US Market Open

Data as of 1330GMT

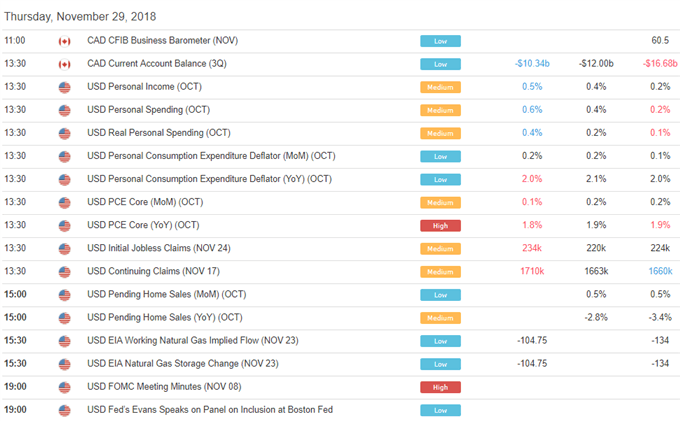
DailyFX Economic Calendar: Thursday, November 29, 2018 – North American Releases

AUD at Resistance, Russian Jawboning Lifts Oil - US Market Open

DailyFX Webinar Calendar: Thursday, November 29, 2018

AUD at Resistance, Russian Jawboning Lifts Oil - US Market Open

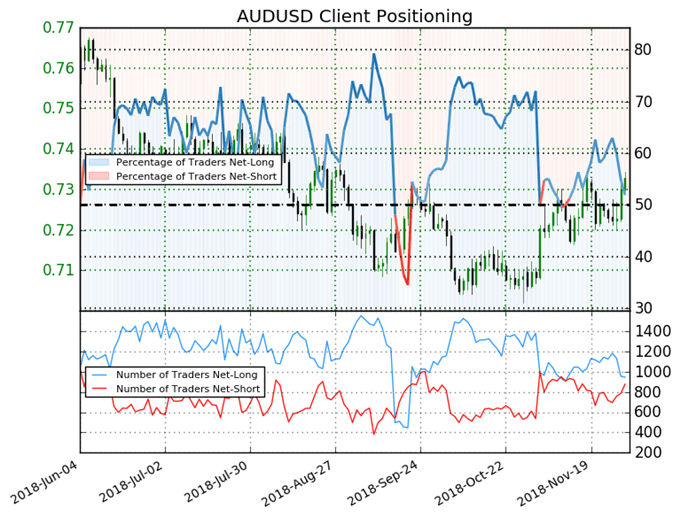
IG CLIENT SENTIMENT AUDUSD Chart of the Day

AUD at Resistance, Russian Jawboning Lifts Oil - US Market Open

AUDUSD: Data shows 51.9% of traders are net-long with the ratio of traders long to short at 1.08 to 1. In fact, traders have remained net-long since Nov 13 when AUDUSD traded near 0.71739; price has moved 2.2% higher since then. The number of traders net-long is 16.2% lower than yesterday and 16.4% lower from last week, while the number of traders net-short is 3.5% higher than yesterday and 4.7% higher from last week.

We typically take a contrarian view to crowd sentiment, and the fact traders are net-long suggests AUDUSD prices may continue to fall. Yet traders are less net-long than yesterday and compared with last week. Recent changes in sentiment warn that the current AUDUSD price trend may soon reverse higher despite the fact traders remain net-long.

Five Things Traders are Reading

  1. “Brexit ’Doomsday’ Warnings Ignored by a Resilient Sterling” by Nick Cawley, Market Analyst
  2. “EURUSD Chart Near-Term Bullish After Outside Range Day”by Martin Essex, MSTA , Analyst and Editor
  3. “Crude Oil Analysis: WTI breaches $50, Bears Eye Critical Support” by Justin McQueen, Market Analyst
  4. “Global Market Rally Needs Dovish Fed and Positive US-China Trade War Update” by Justin McQueen, Market Analyst
  5. “GBP Price Falls After Dire Warnings For UK Economy After Brexit” by Martin Essex, MSTA , Analyst and Editor

— Written by Justin McQueen, Market Analyst

To contact Justin, email him at Justin.mcqueen@ig.comFollow Justin on Twitter @JMcQueenFX


Source link


https://ift.tt/2TW3mW3

mercredi 28 novembre 2018

US Dollar Strength in Focus Ahead of Powell; USD/CAD Nears Resistance


EUR/USD Resistance at 1.1300, USD/CAD to Fresh Highs Ahead of Powell

US Dollar Talking Points:

– The US Dollar is holding around a resistance level that came into play yesterday at 97.50. This follows another topside bump on the back of some comments from FOMC Vice Chair, Richard Clarida. As discussed in yesterday’s webinar, there may be an element of miscommunication here as market participants had inferred the omission of the word ‘some’ to indicate a more-hawkish stance than what Mr. Clarida had signaled just a month ago.

– US stocks continue this week’s bounce from support, and this follows last week’s close near monthly lows in the Dow, S&P 500 and Nasdaq 100. Deductively, it would appear that there is building anticipation for FOMC Chair Jerome Powell to take a softer touch to markets when he speaks at the Economic Club of New York later today. That speech is scheduled for Noon ET, and a softer stance from Mr. Powell could bring on a pullback in the US Dollar to go along with a continuation of the recovery move currently showing in US bourses.

– DailyFX Forecasts on a variety of currencies such as the US Dollar or the Euro are available from the DailyFX Trading Guides page. If you’re looking to improve your trading approach, check out Traits of Successful Traders. And if you’re looking for an introductory primer to the Forex market, check out our New to FX Guide.

Do you want to see how retail traders are currently trading the US Dollar? Check out our IG Client Sentiment Indicator.

US Dollar Finds Resistance, US Equity Recovery Continues Ahead of Powell Speech

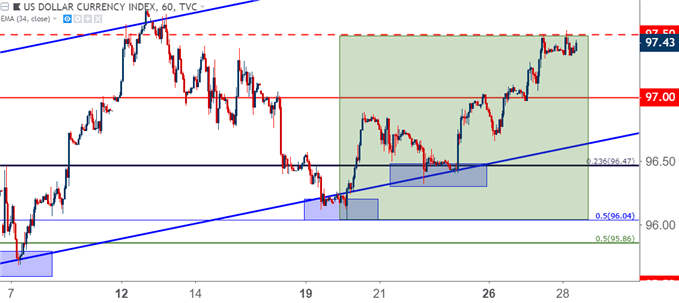
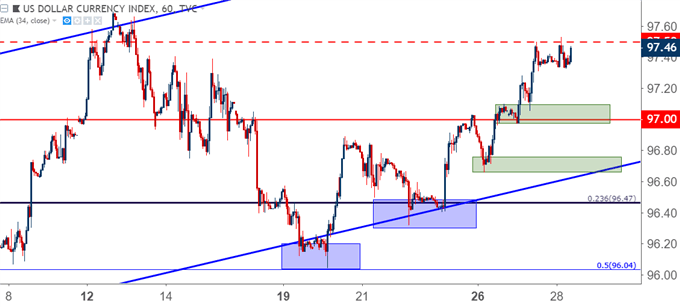
The US Dollar is seeing a bit of resistance in the bullish move that came back to life a week ago. While last Tuesday brought in a support test at a key Fibonacci level in the currency, the following week saw buyers come back with gusto as the US Dollar re-claimed ground above the 97.00 level. But, since hitting resistance at the psychological level of 97.50 yesterday, bulls haven’t been able to make much progress, and this is likely due to the fact that a big speech is on the calendar for later today when FOMC Chair Jerome Powell speaks at the Economic Club of New York. This is on the docket for Noon Easter Time, so right in the middle of the US trading session.

US Dollar Hourly Price Chart
us dollar hourly price chart usd

Chart prepared by James Stanley

Fed Policy as a Macro Pressure Point

FOMC policy has recently come into the picture as a pressure point for global markets, joining themes of Brexit, the Italian budget, and trade wars/tariffs. While the rest of these risks have existed and even been known for some time, it’s only recently that the ‘wall of worry’ has appeared to impact equities in the United States. Throughout Q3, while Brexit remained messy and while the potential stand-off between Italy and the European Commission was in full view, US stocks continued to rally up to fresh all-time-highs, and this was taking place along with increased tension on the trade tariff front.

It wasn’t until we turned the page into Q3 that this started to change, and October ushered in a far different tonality in US risk markets than what was seen just a month earlier. Comments earlier in the month from FOMC Chair Jerome Powell appeared to frighten market participants, when the head of the world’s largest Central Bank indicated that the FOMC was ‘far away from the neutral rate.’

This would imply more rate hikes in the future as the bank strives to attain that rate that’s neither stimulative nor restrictive, and on the heels of these comments stocks started to show pressure, and that lasted into the end of the month. What did seem to finally help were some comments in late-October at FOMC Vice Chair Richard Clarida’s first public engagement, when he said that ‘some further gradual tightening’ will be needed, indicating that the neutral rate might be closer than Mr. Powell had previously hinted at. This helped stocks to build-in some support, and prices rallied through the first week of November.

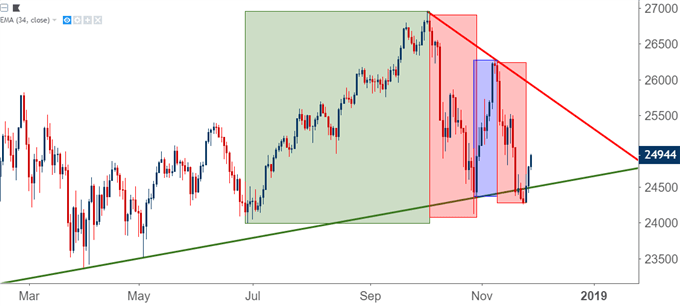
Dow Jones Daily Price Chart: Q3 Strength Yields to October Weakness; November Recovery Stops around FOMC
djia dow jones daily price chart

Chart prepared by James Stanley

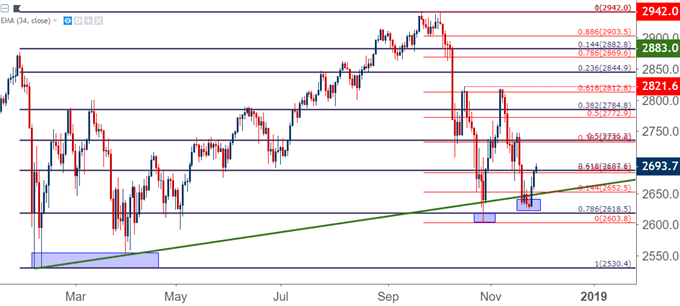
That recovery was soon halted around the FOMC’s November rate decision. US stocks topped-out around this meeting and that recovery was soon yielding to sellers and lower prices. That weakness remained into last week’s close; and a bit of recovery has started to show around this week’s open. This appears to be in anticipation of the Powell speech on the calendar for later this afternoon, with the expectation that we may see a slightly softer stance than what took place in October. Given that the November rate decision did not carry an accompanying press conference, this would be an ample opportunity for Chair Powell to opine on the state of global markets in relevance to FOMC policy.

SPX 500 Daily Price Chart: Attempting to Bounce From Higher-Low Support
s&p 500 daily price chart

Chart prepared by James Stanley

US Dollar Pullback or Reversal Potential

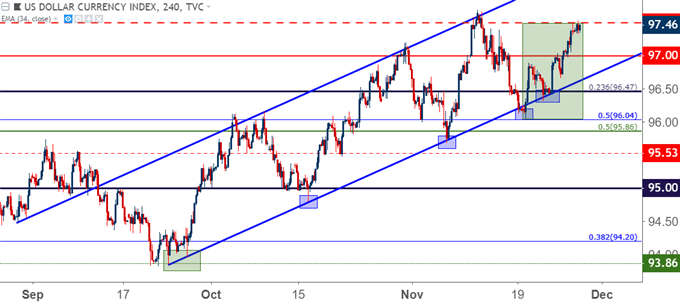
Another item of interest around the Fed is the US Dollar, as the currency has been in a bullish trend ever since the September rate hike. This is when the topside channel in the currency began, and over the past couple of weeks, support has started to come into play with greater frequency.

US Dollar Four-Hour Price Chart
us dollar usd four hour price chart

Chart prepared by James Stanley

Yesterday brought an interesting driver into this mix, and as was discussed in yesterday’s webinar, this may have been a case of miscommunication. In a speech early in yesterday’s session, FOMC Vice Chair Richard Clarida said ‘further gradual tightening’ will be needed at the Fed; very similar to albeit slightly different from his comments in late-October when he said ‘some further gradual tightening’ may be needed. The difference here is the world ‘some,’ and because this wasn’t included in yesterday’s comments, ‘some’ market participants inferred this to mean that Mr. Clarida was more hawkish than he was just a month ago.

On the heels of those comments yesterday, the Dollar jumped-higher and stocks probed-lower, illustrating a fairly clear response in each market. As each of those have calmed in the 24 hours since, with the Dollar finding resistance and stocks continuing to rally, traders can move forward with a bit of information that could be useful today. If Jerome Powell is able to sooth market participants’ fears, a deeper pullback could show in the US Dollar to go along with a continuation of this week’s strength in US stocks. But, if he comes out of the gates as he did in October, with visible optimism to go along with some hawkish commentary, US Dollar strength and US stock weakness could soon be back in the cards.

US Dollar Hourly Price Chart: Support Potential Applied
us dollar hourly price chart

Chart prepared by James Stanley

EUR/USD Finds Resistance at 1.1300 but Bears Unmotivated

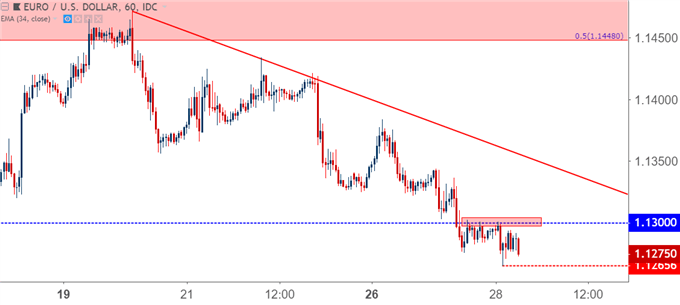
EUR/USD sellers remained in-charge through this week’s open, helping to bring on another support test at the key level of 1.1300. Bears were able to push through yesterday morning, but there wasn’t much motivation to continue the move after prices tested below this key level.

Since yesterday afternoon, this price of 1.1300 has helped to provide near-term resistance on the pair. Sellers were even able to tip their toes into the water around this morning’s European open, leading to a quick test below yesterday’s lows before buyers soon pushed prices right back into that prior short-term range. While it’s unlikely that we’ve seen total capitulation at this point, this could be a signal that the pair is ripe for a pullback as sellers have been able to bring much drive below 1.1300. If the ground was open for further downside, sellers had ample opportunity to push-lower following this short-term support break earlier this morning. But they didn’t, and Euro bears should question ‘why.’

EUR/USD Four-Hour Price Chart
eurusd eur/usd hourly price chart

Chart prepared by James Stanley

GBP/USD Holds Trend-Line Support

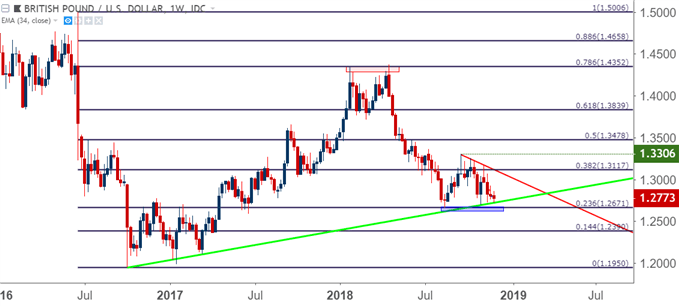
In yesterday’s webinar, I looked at GBP/USD setting up in a potential bear trap. While bulls appear to have been on hiatus around the pair over the past few weeks, the bigger item of concern for short-side continuation was the build of support around a long-term level of interest.

In mid-August, the yearly low in the pair printed off of the 23.6% Fibonacci retracement of the Brexit move. Since then, multiple downside approaches have been thwarted ahead of this level, and of recent, support has gotten an assist from an old trend-line projection, connecting the flash crash lows in the pair from October of 2016 up to the March, 2017 swing lows.

This can make for a difficult spot on the chart for bears, as each short-term support break is met by another support level very nearby. Prices are again bouncing off of this trend-line projection this morning, and this can further complicate bearish continuation approaches.

GBP/USD Weekly Price Chart
gbpusd gbp/usd weekly price chart

Chart prepared by James Stanley

USD/CAD Fresh Five-Month Highs

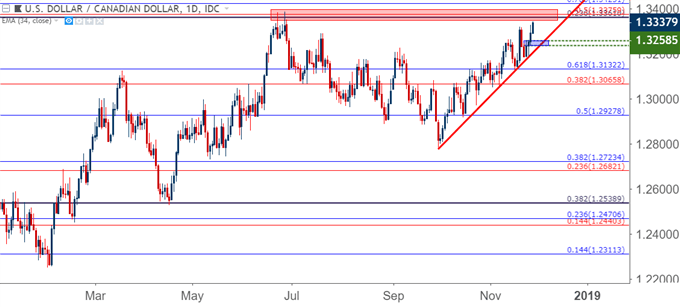
For USD-strength strategies, EUR/USD can be difficult given the test at this long-term area of support. Of recent, I’ve been looking to USD/CAD for that driver and the past few weeks have shown multiple items of interest on that front.

Earlier this week, a bullish trend-line came into play after prices pulled back from fresh four-month highs set last week. Buyers quickly returned, and price action has now posed a push up to fresh five-month highs.

Prices are now approaching a big area of resistance from 1.3361-1.3376, as each of these levels are long-term Fibonacci retracements that helped to cauterize the yearly high in June of this year. Traders should tread very carefully at this point, and a pullback towards that trend-line of support may be needed to re-open the door for additional long positions.

USD/CAD Daily Price Chart: Bullish Trend Approaches Key Resistance
usdcad usd/cad daily price chart

Chart prepared by James Stanley

To read more:

Are you looking for longer-term analysis on the U.S. Dollar? Our DailyFX Forecasts for Q4 have a section for each major currency, and we also offer a plethora of resources on USD-pairs such as EUR/USD, GBP/USD, USD/JPY, AUD/USD. Traders can also stay up with near-term positioning via our IG Client Sentiment Indicator.

Forex Trading Resources

DailyFX offers a plethora of tools, indicators and resources to help traders. For those looking for trading ideas, our IG Client Sentiment shows the positioning of retail traders with actual live trades and positions. Our trading guides bring our DailyFX Quarterly Forecasts and our Top Trading Opportunities; and our real-time news feed has intra-day interactions from the DailyFX team. And if you’re looking for real-time analysis, our DailyFX Webinars offer numerous sessions each week in which you can see how and why we’re looking at what we’re looking at.

If you’re looking for educational information, our New to FX guide is there to help new(er) traders while our Traits of Successful Traders research is built to help sharpen the skill set by focusing on risk and trade management.

— Written by James Stanley, Strategist for DailyFX.com

Contact and follow James on Twitter: @JStanleyFX


Source link


https://ift.tt/2QlmmhP