Affichage des articles dont le libellé est Alerts. Afficher tous les articles

vendredi 7 décembre 2018

Markets Crash to Fresh Yearly Lows


Bitcoin, Bitcoin Cash, Ethereum, Ripple: Prices, Charts and Analysis

  • Cryptocurrency market hits a fresh 2018 low and market cap may fall below $100 billion.
  • Bitcoin Cash (BCH) is in freefall.

Cryptocurrency Market Hammered Lower

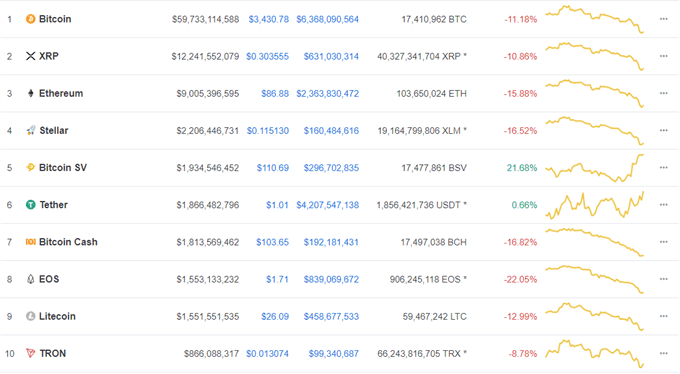
The cryptocurrency market as a whole made a fresh low for 2018 with its market cap falling to just over $108 billion, down from $835 billion at the start of the year. Turnover picked up as the market fell – a negative sign – while a lot of the charts have no solid support lines/areas left that are clear and qualifiable.

News that the SEC had once again delayed a decision on the VanEck bitcoin ETF until the end of February 2019 sent the market spinning lower. The SEC said that it is ‘appropriate to designate a longer period within which to issue an order approving or disapproving the proposed rule change so that it has sufficient time to consider this proposed rule change.’ The worry for the VanEck ETF is that continued market volatility will make it harder for the SEC to allow it to issue an ETF.

Many of the top 10 cryptos are suffering double-digit losses in the last 24 hours, taking out weak support levels along the way. Bitcoin (BTC) continues to trade towards support at just under $3,000, and if this breaks the July 16, 2017 swing low at $1,780 comes into play. Ethereum (ETH) currently trades around $84 and is now looking at the May 2017 swing-low at $62, while Litecoin (LTC) trades at $25 and may fall to the May 2017 low around $18. Bitcoin Cash (BCH) has probably been the largest fallers in the past few weeks, slumping from $634 to $100 in just one month.
Bitcoin, Ethereum, Ripple: Markets Crash to Fresh Yearly Lows

Investors remain net-long cryptocurrencies but recent changes give us a mixed trading bias – for example the number of traders net-short Bitcoin is up from last week. You can sign up to the IG Client Sentiment Indicator for free to get updated positioning data.

Cryptocurrency Trader Resources – Free Practice Trading Accounts, Guides, Sentiment Indicators and Webinars

If you are interested in trading Bitcoin, Bitcoin Cash, Ethereum, Litecoin or Ripple we can help you begin your journey. We have an Introduction to Bitcoin Trading Guide along with a Free Demo Account so you can practice trading this volatile asset class.

What’s your opinion on the latest cryptocurrency sell-off? Share your thoughts and ideas with us using the comments section at the end of the article or you can contact me on Twitter @nickcawley1 or via email at nicholas.cawley@ig.com.

— Written by Nick Cawley, Analyst.


Source link


https://ift.tt/2BXqRXV
Oil Soars After OPEC+ Meeting Agree Production Cuts


Oil and OPEC+:

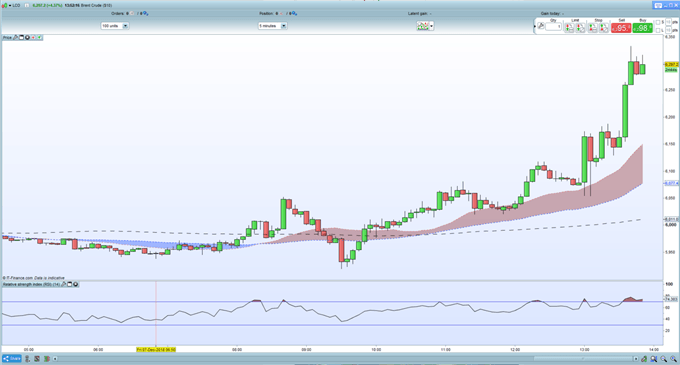
  • Brent crude touches $63/bbl. after production cuts revealed.
  • Brent nears a two-week high after heavy sell-off.

Q4 Trading Forecasts including Oil.

Oil Turns Sharply Higher on Production Cuts

The latest OPEC+ meeting in Vienna agreed to remove 1.2 million barrels a day from the market, according to delegates on Friday. The announcement sent oil spinning higher with Brent trading back above $63/bbl. and nearing levels last seen two weeks ago. Brent crude recently entered a bear market after falling from a high price of $86.65/bbl. at the start of October to a low around $57.75/bbl. last week.

Oil Five-Minute Price Chart December 7, 2018

 Oil Soars After OPEC+ Meeting Agree Production Cuts

Retail traders are 86.2% net-long US Crude according to the latest IC Client Sentiment Data, a bearish contrarian indicator. However, recent changes in daily and weekly positions currently give us a stronger negative trading bias.

Traders may be interested in two of our trading guides – Traits of Successful Traders and Top Trading Lessons – while technical analysts are likely to be interested in our latest Elliott Wave Guide.

What is your view on Oil – bullish or bearish?? You can let us know via the form at the end of this piece or you can contact the author at nicholas.cawley@ig.comor via Twitter @nickcawley1.


Source link


https://ift.tt/2QmU4UX

USD Drops as NFP Report Disappoints, However, Fed Outlook Unchanged


NFP Analysis and Talking Points

  • US Nonfarm Payrolls rose by 155k in November, missing expectations of 198k expected; Prior month revised Lower
  • US Average Hourly Earnings on the month falls short of consensus

See our latest Q4 FX forecast to learn what will drive the currency through the quarter.

NFP Report Review

US Bureau of Labor Statistics reported total nonfarm payroll (NFP) employment expanded by a 155k jobs in November, missing expectations of 198k. Alongside this, the headline figure for the prior month saw slight downward revision to 237k from 250k, resulting in a 2-month net revision of -12k. The unemployment rate remained at the lowest level since 1969 at 3.7%, which will continue to the delight of Fed officials given that they see NAIRU at 4.5%.

Wage Growth Holds Above 3%

The Fed focussed wage data rose in line with expectations for the yearly rate at 3.1%. However, monthly rate slightly disappointed expectations, rising 0.2%, short of the 0.3% expected, while the prior month saw a downward revision to 0.1%. Overall, despite the disappointment in today’s report, this does not change the outlook for the Fed. That said, the average gains in jobs for 2018 has been at 206k compared to 183k in 2017.

Market Response

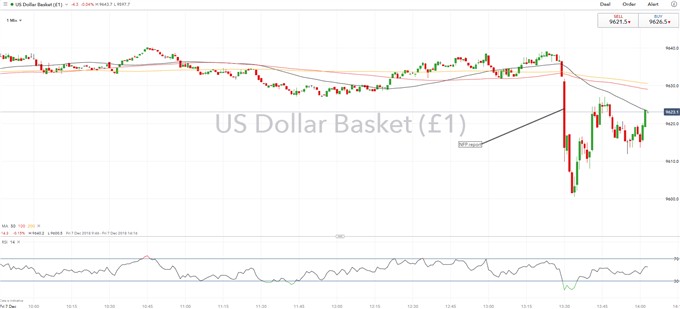
The soft jobs reports saw a weaker US Dollar upon release to pare its earlier advances with the DXY trading in the middle of its daily range. The move however was relatively minimal judging by historical standards, given that the report does not alter the Fed outlook a great deal.

DXY Price Chart 1: 1-minute time frame (Intra-day)

USD Drops as NFP Report Disappoints, However, Fed Outlook Unchanged

Chart by IG

— Written by Justin McQueen, Market Analyst

To contact Justin, email him at Justin.mcqueen@ig.com

Follow Justin on Twitter @JMcQueenFX


Source link


https://ift.tt/2QfQTOC

Consumer Confidence Remains Stable but Future Expectations Wane


Talking Points:

  • The index of current conditions jumped 2.9 points to 115.2 from 112.3 in November
  • Consumer expectations dipped which could suggest lower confidence in current conditions in coming reports
  • Respondents noted hearing more negative news about job prospects as non-farm payrolls disappoint

Current Conditions Remain Strong

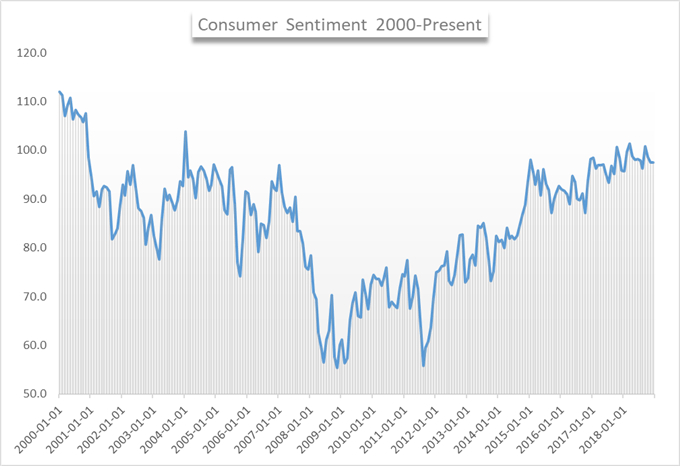
The monthly survey of consumers from the University of Michigan was released Friday morning to reveal no-change from November for consumer sentiment. The index read 97.5 and equals the average from January 2017 to December 2018. According to Richard Curtin, the survey’s curator, the last time the sentiment index was consistently above 90 for at least this long was from 1997 to 2000. During that time, the four-year average was 105.3.

university of michigan consumer sentiment december

Learn to trade around news events and data releases with our Introduction to Forex News Trading guide.

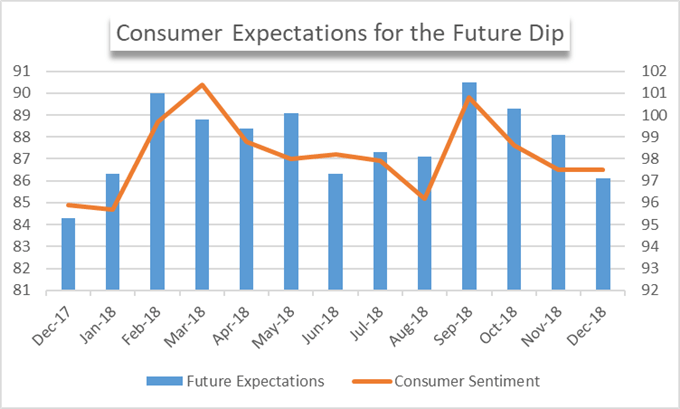
Respondents also saw strength in current economic conditions. Despite an equity market tumble and rising costs from the US-China trade war, the current conditions index rose to 115.2 from 112.3 in November. Conversely, future expectations read slightly lower.

university of michigan future expectations december

The index of consumer expectations was the sole area of December’s report that read lower. While it suffered a slight decline, the change from 88.1 to 86.1 is well within the acceptable range and was easily offset by the uptick in current conditions.

That said, the index has declined for four months straight and various factors have been to blame. In previous declines, rising interest rates were cited as consumers voiced concern over higher borrowing costs. This month, the headline concerns were job prospects for the future.

Non-Farm Payrolls Fall Short

The concern was verified from a hard data perspective after a disappointing non-farm payroll release also on Friday. Still, the unemployment rate remained at a multi-year record 3.7%. With the list of concerns for the future growing, future reports may begin to see a slight dip in consumer sentiment. As a leading indicator, a dip in confidence would bolster the argument of many speculators that assert global growth is slowing. But currently, consumers remain confident and the holiday season offers an opportunity for increased consumer expenditure.

–Written by Peter Hanks, Junior Analyst for DailyFX.com

Contact and follow Peter on Twitter @PeterHanksFX

Read more: S&P 500 Plunges, DAX Enters Bear Market on Trade War Fears

DailyFX forecasts on a variety of currencies such as the US Dollar or the Euro are available from the DailyFX Trading Guides page. If you’re looking to improve your trading approach, check out Traits of Successful Traders. And if you’re looking for an introductory primer to the Forex market, check out our New to FX Guide.


Source link


https://ift.tt/2UqUckp

Rumors and Delays Press Down on Sterling (GBP)


Sterling, Brexit and US dollar:

  • TV debate between May and Corbyn now looking very unlikely.
  • Brexit vote on December 11 may be delayed.
  • GBPUSD may find support if US non-farm payrolls miss.

Q4 Trading Forecasts including USD and GBP.

Brexit Latest

The proposed tv debate between UK PM Theresa May and leader of the opposition Jeremy Corbyn is looking dead in the water after ITV pulled out of hosting the debate, days after the BBC pulled its bid to air the event. The event that was expected to be aired live on Sunday December 9 was an opportunity for both May and Corbyn to put forward their views and plans on Brexit just two days before the vote in the House of Commons.

And this vote may now be in doubt after senior Conservative members want the vote postponed allowing more time to be dedicated to the contentious backstop proposal. PM May is expected to lose the vote heavily on Tuesday and a delay would also allow her more time to shore up votes. The chairmen of the influential Conservative group, the 1922 Committee, said that getting clarity about how the UK could remove the backstop was more important than the timing of the vote. PM May has said that the vote will go ahead as planned.

Related Brexit and Sterling Articles:

GBPUSD: Sterling Support Remains Fragile as Brexit Chaos Continues.

Brexit Latest: Sterling (GBP) Sinks as UK PM May Loses Control.

Brexit Impact on GBP: How the Pound Might Move After Parliamentary Vote

GBPUSD continues to trade sideways and remains vulnerable to further losses as the debate about the vote continues. The pair may find some solace from today’s US jobs report at 13:30 GMT where the headline figure is expected lower than last month. The US dollar has come under pressure in the last few days with the market now pairing back the timing and the amount of US interest rate hikes in 2019. Recent US Treasury yield curve inversion has prompted fears of a recession in mid-2020 in the US, tempering previous rate hike expectations.

DailyFX senior currency analyst Chris Vecchio will be covering the US Non-Farm Payroll Report live from 13:15 GMT.

GBPUSD Daily Price Chart (February – December 7, 2018)

Brexit Latest: Rumors and Delays Press Down on Sterling (GBP)

Retail traders are 63.1% net-long GBPUSD, according to the latest IC Client Sentiment Data, a bearish contrarian indicator. However, recent changes in daily and weekly positions suggest the pair may move higher despite the fact that traders are net-long.

Traders may be interested in two of our trading guides – Traits of Successful Traders and Top Trading Lessons – while technical analysts are likely to be interested in our latest Elliott Wave Guide.

What is your view on GBPUSD – bullish or bearish?? You can let us know via the form at the end of this piece or you can contact the author at nicholas.cawley@ig.comor via Twitter @nickcawley1.


Source link


https://ift.tt/2AY1bZt

Asian Stocks Gain On Hopes Fed May Hold Fire, US Payrolls Up Next


Asian Stocks Talking Points:

  • Stocks were broadly higher on a Wall Street Journal report suggesting that the pace of US rate rises may slow
  • The US Dollar slipped back a little on the same basis
  • A key US labour report will dominate the rest of Friday

Find out what retail foreign exchange investors make of your favorite currency’s chances right now at the DailyFX Sentiment Page

Asian equity markets got some respite to end the week thanks to a report from the Wall Street Journal which suggested that US interest rates may not rise as fast as some had feared. The paper said that the central bank is mulling a ‘wait-and-see’ approach, and that officials are unsure as to what their next move will be after this month’s policy decision.

This story had brought Wall Street stocks off their lows in the previous session, and it seems to have supported local bourses too. The Nikkei rose 0.8%, with the Hang Seng up 0.2% in the middle of the Hong Kong afternoon. Shanghai stocks were up by a whisker with Sydney’s ASX 200 in the green by 0.4%.

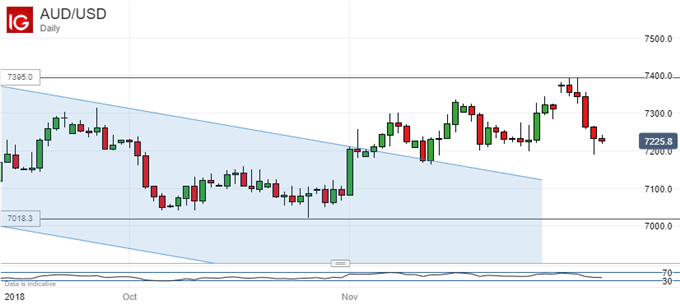
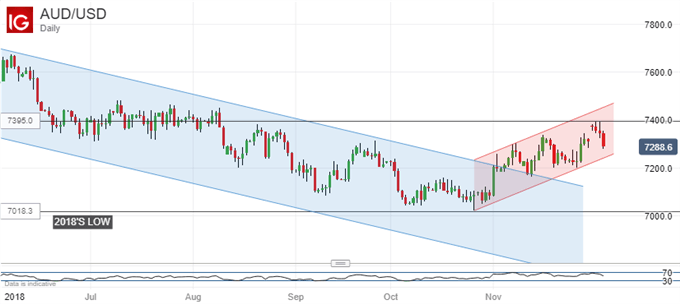
The US Dollar was broadly weaker thanks to the same market Federal Reserve prognosis that lifted stocks. Focus now will be on Friday’s official labor market report. Nonfarm payrolls are expected to have expanded by 198,00 in November, with the unemployment rate seen steady at 3.7%. The Australian Dollar remains pressured by a variety of foreign and domestic factors, not least this week’s disappointing growth report from its home country. AUD/USD has been wilting all week and now looks at risk of a return to the daily-chart downtrend which characterized much of this year’s trade. It is highlighted in blue on the chart below.

Fading fast. Australian Dollar Vs US Dollar, Daily Chart

Gold prices look set for their strongest week since August, thanks to a broad fall in risk appetite even if that was no so evident Friday. Crude oil prices slipped on news that OPEC will make production cuts dependent on participation from non-member Russia.

Still to come on the day’s economic data slate are German industrial production numbers, the Bank of England’s inflation look-ahead and news of Eurozone government spending. Canadian unemployment figures are also coming up, as is the Mexican Consumer Price Index and the University of Michigan’s consumer sentiment snapshot.

However all of those are likely to be mere warm-up acts for those US employment numbers.

Resources for Traders

Whether you’re new to trading or an old hand DailyFX has plenty of resources to help you. There’s our trading sentiment indicator which shows you live how IG clients are positioned right now. We also hold educational and analytical webinars and offer trading guides, with one specifically aimed at those new to foreign exchange markets. There’s also a Bitcoin guide. Be sure to make the most of them all. They were written by our seasoned trading experts and they’re all free.

— Written by David Cottle, DailyFX Research

Follow David on Twitter@DavidCottleFX or use the Comments section below to get in touch!


Source link


https://ift.tt/2QfkKH7

jeudi 6 décembre 2018

Sterling Support Remains Fragile as Brexit Chaos Continues


Sterling, Brexit and the US Dollar:

  • Deal, no deal, delayed Brexit, no Brexit vote – the permutations increase daily.
  • GBPUSD respects support but backdrop favors another test shortly.

Q4 Trading Forecasts including USD and GBP.

Sterling (GBP) Likely to Re-Test Support

The UK Parliamentary vote on PM May’s Brexit deal, scheduled for December 11, may be delayed according to the latest round of rumors, to give the beleaguered PM more time to shore up support for her increasingly unpopular deal.PM May is facing increasing criticism from all sides over her Brexit deal and has now said that there are three options; her deal, no deal or no Brexit, echoing comments made by the President of the European Council Donald Tusk last week. The addition of a no Brexit option is a new development by PM May who has always argued that no deal is better than a bad deal. In addition, the European Court of Justice (ECJ) who recently opined that the UK could unilaterally revoke Article 50 and stay in the EU, tweeted that a ruling will be delivered on December 10, one day before the vote in Parliament.

GBPUSD: Current Brexit Deal Won’t Pass Through UK Parliament

Brexit Impact on GBP: How the Pound Might Move After Parliamentary Vote

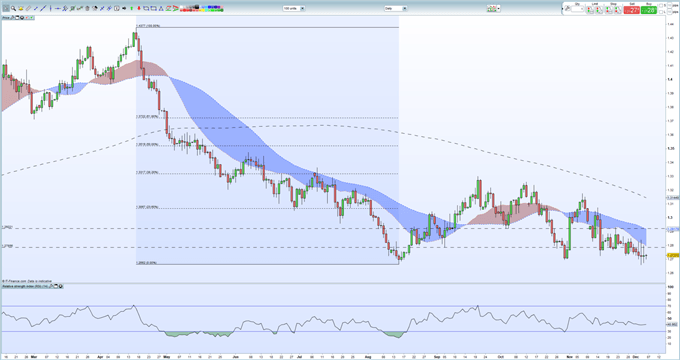
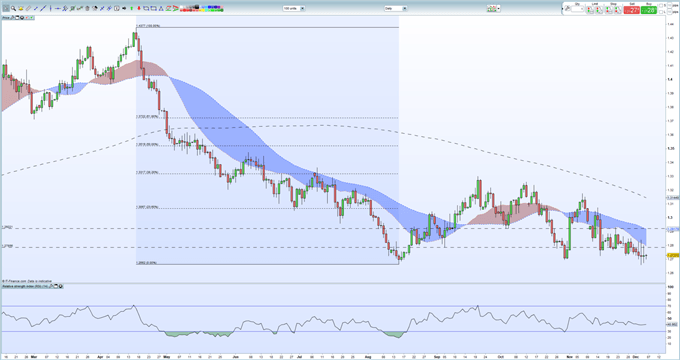
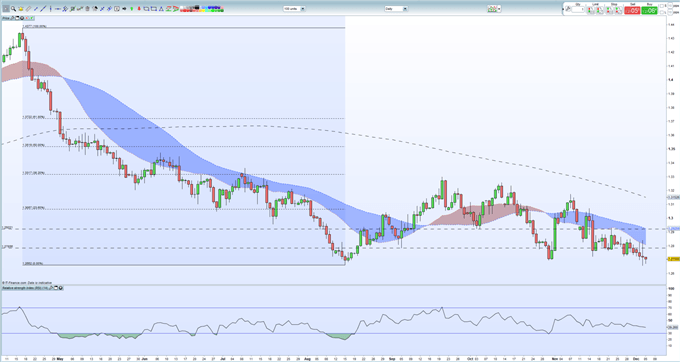
Against this fragile and ever-changing background, GBPUSD continues to trade just above 1.2700, around half-a-cent above its recent multi-month low print around 1.2660. Price action remains negative with the downtrend from the November 7 high still in place, while the pair trade below all three moving averages. The RSI indicator is relatively stable despite the weak market outlook.

GBPUSD Daily Price Chart (February – December 6, 2018)

GBPUSD: Sterling Support Remains Fragile as Brexit Chaos Continues

Retail traders are 67.4% net-long GBPUSD, according to the latest IC Client Sentiment Data, a bearish contrarian indicator. However, recent changes in daily and weekly positions currently give us a mixed trading bias.

Traders may be interested in two of our trading guides – Traits of Successful Traders and Top Trading Lessons – while technical analysts are likely to be interested in our latest Elliott Wave Guide.

What is your view on GBPUSD – bullish or bearish?? You can let us know via the form at the end of this piece or you can contact the author at nicholas.cawley@ig.comor via Twitter @nickcawley1.


Source link


https://ift.tt/2Sz201U

US Household Net Worth Rises to $109 Trillion Over Third Quarter


Talking Points:

  • Financial Assets grew 2.2 percent led by record high equity prices
  • Household leverage increased modestly from expanding consumer credit
  • US stock selloff subsides following the release

American households feel a little wealthier at the end of the third quarter as net worth increases over $2 Trillion from a net worth of $107 Trillion midyear. Total assets increased 1.8 percent to nearly $125 Trillion during the months of July through September led by a 2.2 percent gain in financial assets. Total liabilities increased also albeit a slower pace of 1.1 percent primarily due to expanding consumer credit.

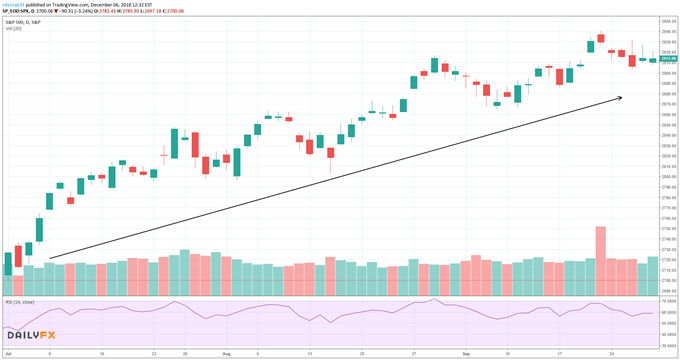
SPX Price Chart (Daily Bars) Third Quarter 2018:

Price Chart of the S&P500 Third Quarter Performance Daily Bars

With the S&P500 notching its all-time high of 2,940.91 the US stock market enjoyed gains exceeding 7 percent. The rise in equities was attributable record corporate profits, consistently strong data coming out of the US economy and strong demand from foreign investors.

Wage growth also had a major impact on the rise in net worth for US households as average hourly earnings rose most recently at a 3.1 percent year-over-year. Tax cuts have likely continued to make a positive impact on household worth as savings trickle down to American pocketbooks. Notable was the annualized rate of change in value of owner’s real estate equity which slowed to 5.6 percent compared to 8.2 percent, 11.4 percent and 10.4 percent over the preceding quarters. This adds to the mounting evidence of concerns over a deteriorating housing market.

The healthy increase in household net worth should support consumer spending headed into the holiday shopping season. However, the backdrop of a robust US economy is beginning to fade. Business owner sentiment is plateauing as forecasts for future economic growth are lowered due to concerns over global trade conflict and international risks such as Brexit. As of December 6, the S&P500 has slid over 8 percent since the beginning of October which will certainly impede additional gains in household net worth if the US stock market cannot recover. Further increases in household leverage and inflationary pressures if materialized could act as a headwind to net worth in the final quarter of 2018.

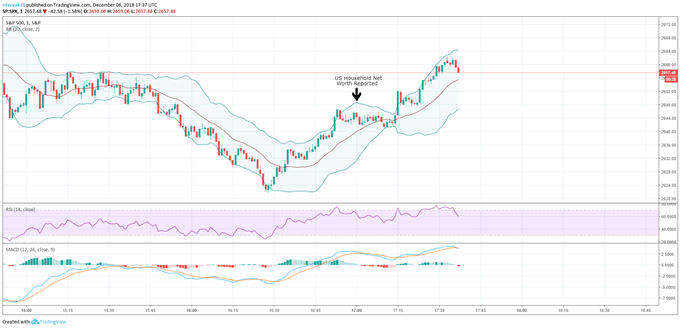
After the report was released, the S&P500 saw some relief from the big selloff in early trading.

Price Chart of the S&P500 on 6 December 2018

To see future data releases on key variables driving markets, check out the DailyFX economic calendar.

–Written by Rich Dvorak, Junior Analyst for DailyFX.com

–Follow on Twitter @RichDvorakFX


Source link


https://ift.tt/2AWVvif

S&P 500 Plunges, DAX Enters Bear Market on Trade War Fears


Talking Points:

  • After a decline in volume on Tuesday and Wednesday, US equities were battered early Thursday
  • Earlier touted trade war progress has since been dismissed and fresh fronts have been opened
  • European indices felt the pressure earlier Thursday as the DAX entered into a bear market

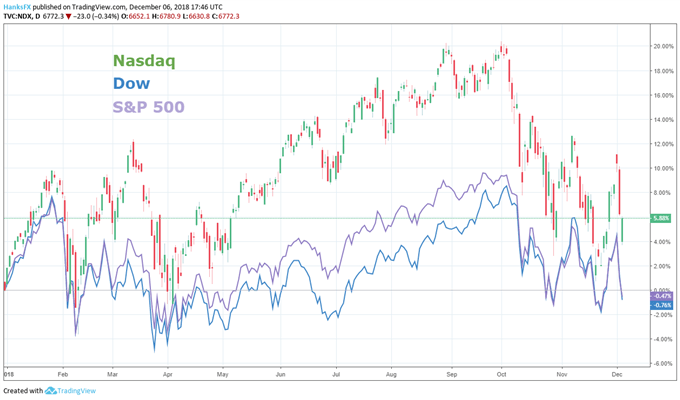
A breakdown in US equity markets followed market participant’s reevaluation of the US-China trade war progress touted by President Trump earlier in the week. The S&P 500 and Dow have now suffered losses in the year-to-date while the Nasdaq remains green.

S&P500, Dow, Nasdaq Price Chart Daily, Year-to-Date (Chart 1)

US Indexes price chart trade war drop

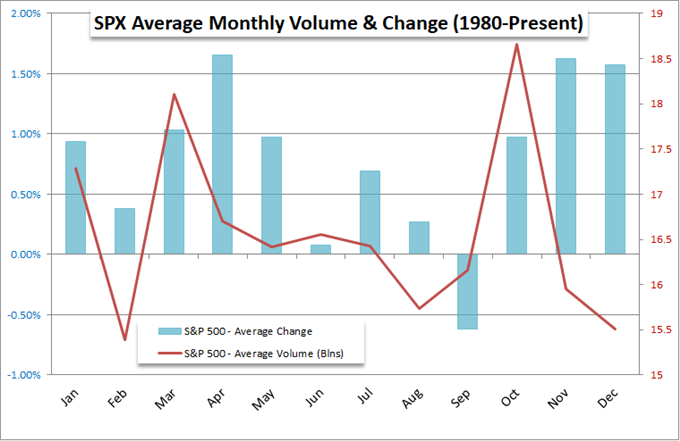
Despite the relatively low historical volume for the month of December, the depth of the recent decline is substantial and could buck the trend. Further, the degree of Thursday’s move is reflected in the CBOE’s VIX or ‘fear index’ which jumped 50% from Tuesday to Thursday’s open despite a strong equity performance to start the week.

S&P 500 Plunges, DAX Enters Bear Market on Trade War Fears

Chart prepared by John Kicklighter

On Monday, President Trump heralded strong progress and a 90-day trade war truce between the two nations and the news sent global indices higher. On Tuesday, geopolitical analysts voiced concerns on the lack of immediately tangible results from the talks.

Markets were closed on Wednesday to honor the passing of former President George H.W. Bush which squashed volume and volatility. The low-volume day halted any significant move in the major indices despite concrete developments in the US-China trade war.

After a day on the sidelines, investors were eager to dump their shares Thursday morning after the arrest of China’s Huawei CFO, also the daughter of Huawei’s CEO. The arrest was made in Canada at the behest of the US Justice Department. Many analysts equate the move to a dangerous new front in the US-China trade war and a substantial increase in tension just days after significant progress was cited. For many, the arrest was the concrete development speculators needed to confirm their suspicions on trade war progress and equities felt the consequences.

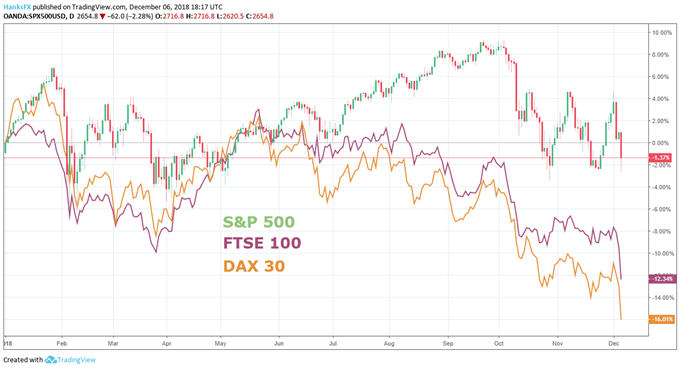
FTSE, DAX, S&P 500 Price Chart Daily, Year-to-Date (Chart 3)

S&P500, FTSE, DAX price chart trade war december

For those watching global markets, the risk-off tone was seen well before US markets opened. Many European indices faced their worst performance in years. The German DAX plummeted -3.48% to a two-year low and entered bear market territory. Similarly, the FTSE 100 shed -3.15%. For both the indexes, the drop is the worst since Brexit.

S&P 500 Price Chart Daily, Year-to-Date (Chart 4)

S&P 500 price chart december decline

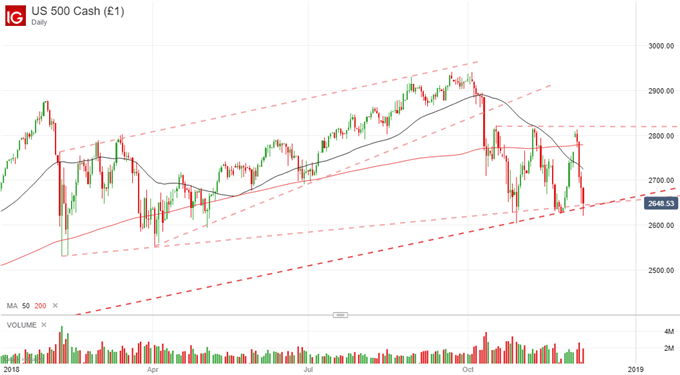
As for the S&P 500, the next few days will be a critical test for the index from a technical perspective. The price trades near trend-line support from February 2016 and a weaker line of support from February of this year. Similarly, the 50-day moving average (DMA) crossed the 200DMA to signal a “death-cross” a technical signal many traders view as a strong bearish development.

Read about the history of major financial crashes and bubbles with “A Brief History of Major Financial Bubbles, Crises, and Flash-crashes.”

If the support lines are broken, it would be reasonable to expect further and deeper declines as the bottom becomes uncertain. On Friday, economic data to reverse the risk-off mood is sparse. With the exception of US unemployment, equity markets may have to wait for next week or a fundamental change in the trade war to regain their footing.

–Written by Peter Hanks, Junior Analyst for DailyFX.com

Contact and follow Peter on Twitter @PeterHanksFX

Read more:Oil Prices Drop on Potential OPEC Disappointment, CAD Extends Losses – US Market Open

DailyFX forecasts on a variety of currencies such as the US Dollar or the Euro are available from the DailyFX Trading Guides page. If you’re looking to improve your trading approach, check out Traits of Successful Traders. And if you’re looking for an introductory primer to the Forex market, check out our New to FX Guide.


Source link


https://ift.tt/2SvcMWQ

FTSE 100 & DAX Break Crucial Support as Trade Wars and OPEC Inspire Losses


Equity Analysis and News

  • Trade War Optimistic Boost Quickly Faded
  • FTSE 100 | Fresh 2018 Lows Opens Scope for Key Fibo
  • DAX | Bearish Sequence Persists with Prices at 2YR Lows

Trade War Optimistic Boost Quickly Faded

The optimistic tone following the G20 summit in which both President Trump and Xi agreed to hold off on further tariff measures had been short-lived, following reports that Canada has arrested Huawei’s CFO at the request of US authorities. This had then prompted China’s Embassy for an immediate release, subsequently raising concerns on trade discussions. Elsewhere, German automaker CEO’s continue to highlight that auto tariff from the US remain on the table.

OPEC Update

Crude oil prices renewed its sell-off with Brent breaking below $60/bbl as the Saudi Arabian Energy Minister stated that all options are on the table including a no-deal. Alongside this, Al-Falih highlighted that they would be prepared for a no-deal, subsequently raising the risk that OPEC may fail to reach an agreement to cut production. However, as is typically the case when OPEC meet, headline risk for oil is elevated. While there hasn’t been an agreement “yet”, the base case is for OPEC+ to reach an agreement to stabilize the energy complex.

How to trade crude oil

OPEC Latest: Oil Prices Renew Sell-Off Ahead of OPEC Meeting

FTSE 100 | Fresh 2018 Lows Opens Scope for Key Fibo

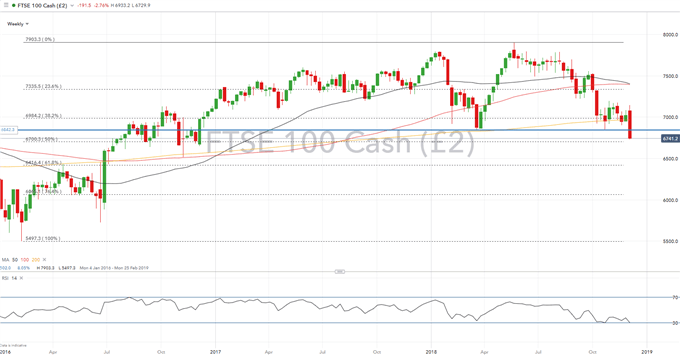
The FTSE 100 has taken a sizeable hit this morning amid the backdrop of plunging oil prices and renewed trade war concerns. Consequently, the FTSE 100 made a break below the 2018 low (6841) to prompt a move below 6800. Among the largest drags on the index is unsurprisingly the energy sector which in taken 40 points off the FTSE, while Chinese exposed firm HSBC shed 15points alone. The FTSE is now eyeing key support at the 6700 level, which also coincides with the 50% Fibonacci retracement, potentially offering some reprieve.

FTSE 100 Price Chart: Weekly Time Frame (Jan 2016 – Dec 2018)

FTSE 100 & DAX Break Crucial Support as Trade Wars and OPEC Inspire Losses

Chart by IG

DAX | Bearish Sequence Persists with Prices at 2YR Lows

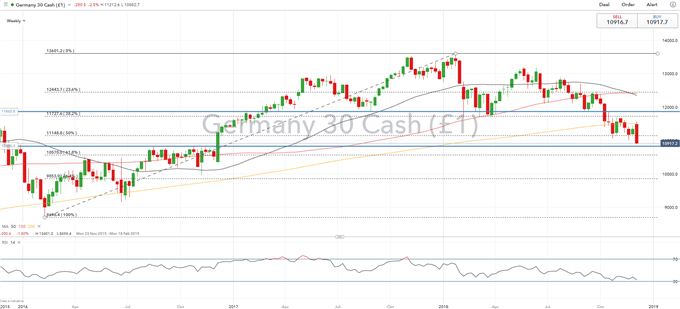
The bearish sentiment shows no signs of easing as the DAX posts a fresh 2yr low. The threat of auto-tariffs and slowing global growths will continue to keep upside limited. Risks remain tilted to the downside, which in turn opens room for a test of support at 10800, while a longer-term target for bears is for a move towards 10500.

How to trade Dax 30

DAX Price Chart: Weekly Time-Frame (Nov 2015 – Dec 2018

FTSE 100 & DAX Break Crucial Support as Trade Wars and OPEC Inspire Losses

— Written by Justin McQueen, Market Analyst

To contact Justin, email him at Justin.mcqueen@ig.com

Follow Justin on Twitter @JMcQueenFX


Source link


https://ift.tt/2QhOMdh

US Dollar Price Action Needs NFP Confirmation, Huawei Hammers Risk


US Dollar, Treasuries and Huawei:

  • US Treasury’s pick-up a safety bid after US-China tensions increase on Huawei CFO arrest.
  • Friday’s non-farm payroll support eyed for continued USD support.

You can access our Q4 USD Trading Forecasts here.

US Dollar (DXY) Back Above Trendline

After briefly dipping below trend at the start of the week, the US dollar basket (DXY) has pushed back above the bullish trendline as the greenback gets a safe-haven bid. News that Chinese telecoms and electrics giant Huawei’s CFO was arrested in Canada over a possible breach of US sanctions on Iran inflamed an already tense US-China trade backdrop and boosted risk-off assets. Buyers returned to the US Treasury market, pushing yields lower, while risk assets fell sharply with global equity markets taking a hefty hit and trading at or near two-year lows. The US Treasury yield curve remains inverted in the shorter-end (3s-5s), indicating that the Federal Reserve may need to loosen monetary policy from 2020 onwards.

US Dollar Price Action Needs NFP Confirmation, Huawei Hammers Risk

The US economy remains robust but with recessionary fears being stoked by the UST yield curve, Friday’s non-farm payroll report will need to confirm the strength of the economy to keep the US dollar basket (DXY) above trend.

US Dollar Price Action Needs NFP Confirmation, Huawei Hammers Risk

DailyFX senior currency strategist Chris Vecchio will be dissectingthe NFP report live on Fridayfrom 13:15 onwards.

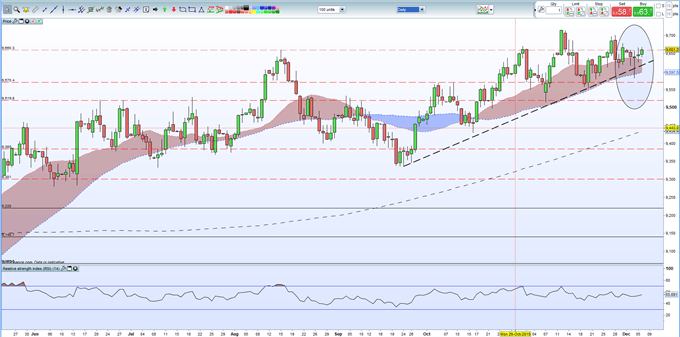
The US dollar basket has broken back above its uptrend and is looking to make a fresh weekly high. DXY currently trades above all three moving averages, with the 20- and 50-day mas now providing support, while the uptrend kicks-in around 96.20. A weak NFP reading may see these support levels tested.

US Dollar (DXY) Daily Price Chart (May – December 6, 2018)

US Dollar Price Action Needs NFP Confirmation, Huawei Hammers Risk

Traders may be interested in two of our trading guides – Traits of Successful Traders and Top Trading Lessons – while technical analysts are likely to be interested in our latest Elliott Wave Guide.

What is your view on the US Dollar – bullish or bearish?? You can let us know via the form at the end of this piece or you can contact the author at nicholas.cawley@ig.comor via Twitter @nickcawley1.


Source link


https://ift.tt/2RF5S1s

Nikkei 225 Aims For 2018 Lows, S&P 500 May Gap Down as Yen Gains


Asia Pacific Market Wrap – Trade War Fears, Risk Aversion, Nikkei 225, Japanese Yen

  • Asia Pacific stocks echo market pessimism amidst US-China trade war relief pessimism
  • Nikkei 225 heads for worst performance in about 6 weeks, 2018 lows may be on horizon
  • Wall Street likely to gap lower as anti-risk Japanese Yen gains. All eyes on OPEC meet

Check out our 4Q forecasts for equities in the DailyFX Trading Guides page

As anticipated, Asia Pacific benchmark stock indexes traded broadly lower following weakness in yesterday’s European trading session. Generally, market optimism has been taking a hit in what has been interpreted as a rather underwhelming G20 Leaders’ Summit this past weekend. An inversion in the US yield curve on certain maturities have also weighed against sentiment.

To add more complications to the political front, the Chief Financial Officer of Huawei, a major Chinese tech giant, was arrested for potential violations of US-Iran sanctions. China’s Shanghai Composite traded about 1.50% lower as this seemed to have ignited more US-China tensions. But, the damage to equities was not isolated to the world’s second largest economy.

Japan’s Nikkei 225 traded about 2.53% lower heading towards Thursday’s close, undermined by all sectors. Such an outcome would result in the index’s worst performance over the course of one day in almost six weeks. Meanwhile, Australia’s ASX 200 headed about 0.19% lower, weighed down by materials and financials. South Korea’s KOSPI declined roughly 1.6%.

Looking at currencies, the anti-risk Japanese Yen and Swiss Franc outperformed against their major counterparts. Meanwhile the pro-risk Australian and New Zealand Dollars depreciated. The haven-linked US Dollar, thanks to its world reserve currency status, rose as demand poured into local government bond yields.

US stocks were closed on Wednesday, but S&P 500 futures are now pointing considerably lower (-1.2%). This suggests that market pessimism may continue to reverberate into European stocks and that Wall Street is likely to gap lower. Sentiment-linked crude oil prices are continuing to come under pressure following mixed views on how OPEC may treat 2019 output cuts while US President Donald Trump favors lower prices.

Speaking of, the 175th OPEC meeting in Vienna is taking place over the remaining 24 hours. The Canadian Dollar may get a sigh of relief after yesterday’s less hawkish BoC rate announcement if higher oil prices might be in the cards next year. Otherwise, sentiment-linked currencies such as the AUD and NZD may continue experiencing selling pressure as the anti-risk Japanese Yen pulls further ahead.

Nikkei 225 Technical Analysis

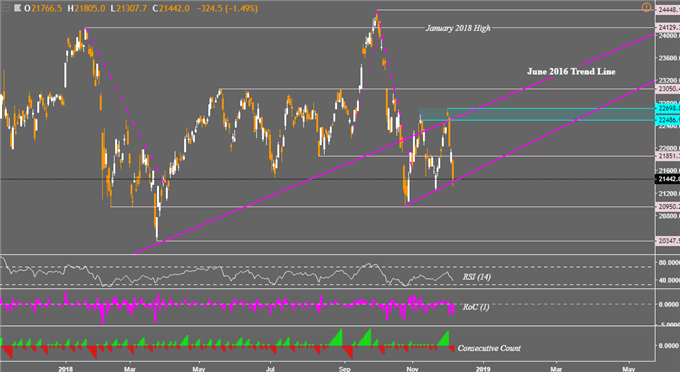
With recent weakness in the Nikkei 225, the index now finds itself sitting squarely on a rising support line from late October. This is after failing to push above a horizontal range of resistance between 22,698 and 22,486. A push through support exposes the October low which is also closely aligned with levels achieved in mid-February and early March at 20,950. Falling through that opens the door to testing the current 2018 low at 20,347.

Nikkei 225 Daily Chart

Nikkei 225 Aims For 2018 Lows, S&P 500 May Gap Down as Yen Gains

Chart created in TradingView

FX Trading Resources

— Written by Daniel Dubrovsky, Junior Currency Analyst for DailyFX.com

To contact Daniel, use the comments section below or @ddubrovskyFX on Twitter


Source link


https://ift.tt/2ro04hm

mercredi 5 décembre 2018

Sterling (GBP) Sinks as UK PM May Loses Control


Sterling and Brexit News:

  • UK to publish Brexit legal agreement in full.
  • MPs to have vote on Brexit back-up.

We have just released our Brand New Q4 Trading Forecasts for GBP.

Sterling (GBP) Touches an 18-Month Low on Brexit Chaos

Sterling continues to slip lower with GBPUSD touching levels last seen in June 2017 late yesterday after UK PM May was found in contempt of Parliament and ordered to publish the legal Brexit agreement in full. In addition, MPs passed an amendment that gives them more of a say on the final Brexit bill if PM May’s agreement is voted down in Parliament next week, which looks very likely. The full legal advice on the Brexit deal will be published at 11:30 GMT and it will be closely parsed by both sides of the House. The House of Commons will also commence day two of five debating the Withdrawal Agreement at the same time.

GBPUSD Falters After May’s Government Found in Contempt.

Sterling slipped lower after yesterday’s announcement and just broke below the GBPUSD 1.2662 18-month low print. The pair nudged back above 1.2700 as the market began to digest the back-up amendment which makes a no-deal Brexit increasingly unlikely. There seems to be growing support in Parliament for a Norway+ agreement, a deal that would be better for Sterling than a no-deal.

Brexit Impact on GBP – How the Pound Might Move After Parliamentary Vote.

GBPUSD remains weak but may have found short-term support at the 1.2660 level although this looks likely to come under pressure. Yesterday’s bearish engulfing candle suggests that there may be another move lower, while the pair trade below all three moving averages. The RSI indicator continues to move lower and still has room to go before it enters oversold territory. Initial resistance remains between 1.2780 and 1.2820.

IG Retail Sentiment data show that 71.6% of traders are net-long GBPUSD, a bearish contrarian indicator. However recent daily and weekly positional shifts suggest the GBPUSD may soon reverse higher.

GBPUSD Daily Price Chart (May – December 5, 2018)

Brexit Latest: Sterling (GBP) Sinks as UK PM May Loses Control

Traders may be interested in two of our trading guides – Traits of Successful Traders and Top Trading Lessons – while technical analysts are likely to be interested in our latest Elliott Wave Guide.

What is your view on GBPUSD – bullish or bearish?? You can let us know via the form at the end of this piece or you can contact the author at nicholas.cawley@ig.comor via Twitter @nickcawley1.


Source link


https://ift.tt/2rlbQZw

BoC to Stand Pat, However, May Signal Concerns Over Oil Plunge


CAD Analysis and Talking Points

  • BoC to Keep Rates at 1.75%
  • Focus on accompanying statement

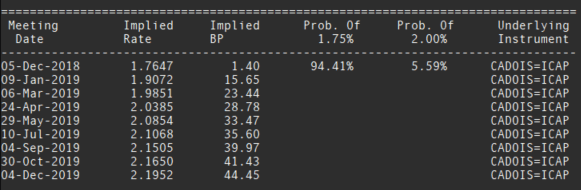
The Bank of Canada will publish its latest interest rate decision at 1500GMT where the central bank is expected to maintain its policy rate at 1.75%, according to OIS (Overnight Index Swaps) markets which attach a 94% likelihood that the central bank will stand pat on interest rates. As such, focus will be on the accompanying monetary policy statement.

CAD Outlook: BoC to Stand Pat, However, May Signal Concerns Over Oil Plunge

Source: Refinitiv (BoC Interest Rate Expectations)

Data continues to warrant further rate hikes

Since the October 24th meeting, the majority of key Canadian data has surprised to the upside, which in turn suggests that further rate hikes are warranted and will likely be reiterated by the Bank of Canada are looking to raise interest rates to neutral as soon as possible. However, one cause of concern has been the unprecedented decline in oil prices, which has increased the downside risks to CAD and the BoC’s economic forecasts.

As a reminder, the Bank of Canada’s MPR forecasts had been based on these oil assumptions.

  • Brent crude close to $80 ($61.60)
  • WTI close to $70 ($53.40)
  • WCS close to $35 ($28.25)

Canadian Economic Data

Date

Latest

Expected

Verdict

Employment Change (Jul)

Nov 2nd

11.2k

10k

Bullish

Unemployment Rate (Jul)

Nov 2nd

5.8%

5.9%

Bullish

Ivey PMI (Oct)

Nov 7th

64.6

56.5 (Prev.)

Bullish

Ivey PMI SA (Oct)

Nov 7th

61.8

50.4 (Prev.)

Bullish

CPI (Oct)

Nov 23rd

2.4%

2.2%

Bullish

CPI (BoC Measure)

Nov 23rd

2.0%

2.0%

Neutral

Retail Sales (Sep)

Nov 23rd

0.2%

0.1%

Bullish

Core Retail Sales (Sep)

Nov 23rd

0.1%

0.3%

Bearish

GDP M/M (Sep)

Nov 30th

-0.1%

0.1%

Bearish

Markit Manufacturing PMI

Dec 3rd

54.9

53.9 (Prev.)

Bullish

Source: DailyFX (Canadian Data Since BoC’s October Meeting)

Trading the BoC

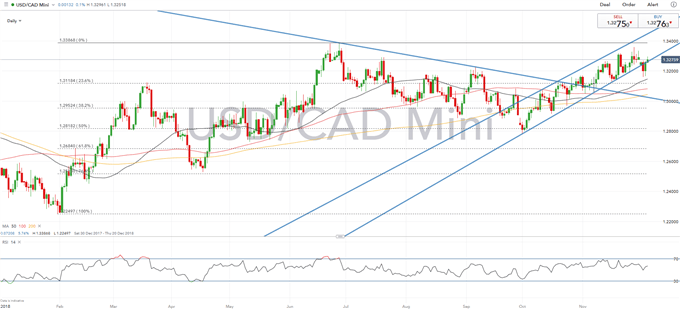
Given that market pricing is largely for an unchanged rate decision, the focus will be on the accompanying statement from the BoC. Market pricing for January remains elevated at 62.5%. However, pricing has moderated slightly given the sell-off in oil markets, alongside rising concerns of deteriorating global growth. As such, a cautious statement from the BoC highlighting global growth concerns could see rate hike bet recede for January, which in turn could take USDCAD back above 1.33. However, if the BoC remain upbeat given the relatively robust economic data, this could see USDCAD revisit 1.32.

Option Pricing suggests that we could see some volatility over the event with vols indicating a break-even of 84pips.

USDCAD Price Chart: Daily Time-Frame (Dec 2017-Dec-2018)

CAD Outlook: BoC to Stand Pat, However, May Signal Concerns Over Oil Plunge

Chart by IG

— Written by Justin McQueen, Market Analyst

To contact Justin, email him at Justin.mcqueen@ig.com

Follow Justin on Twitter @JMcQueenFX


Source link


https://ift.tt/2AVzHDB

Loonie Drifts Lower as Bank of Canada Stands Pat on Rates


Talking Points:

  • Bank of Canada overnight interest rate remains at 1.75 percent
  • Markets pricing lower interest rate path following the report
  • Canadian Dollar Index down half a percent on the news

The Bank of Canada (BOC) announced earlier today that it will hold its overnight interest rate target at its current level of 1.75 percent following the recent increase of 25 basis points in October. In the press release put out with its decision, the BOC seems to paint a dimmer view on economic outlook in suit with the recent narrative shift by global central bankers. A notable difference in language between the press releases little over a month apart is the change from “global economic outlook remains solid” at the end of October to “global economic expansion is moderating” today.

Today’s report states Canada’s economy continues to grow at a moderate pace and in line with third quarter projections, however, buoyed by household spending and export growth. Household spending and export growth have been expanding as tailwinds from minimum wage increases earlier in the year support rising incomes and robust foreign demand sends Canadian goods overseas.

Another positive highlight points to the revision higher for business investment as uncertainty surrounding trade policies are expected to fade after the signing of the US-Mexico-Canada Agreement (USMCA) at the G20 summit in Argentina last weekend. Stabilization of household credit and regional housing markets are listed as other positive developments after the sizeable slowdowns in recent quarters for the two segments.

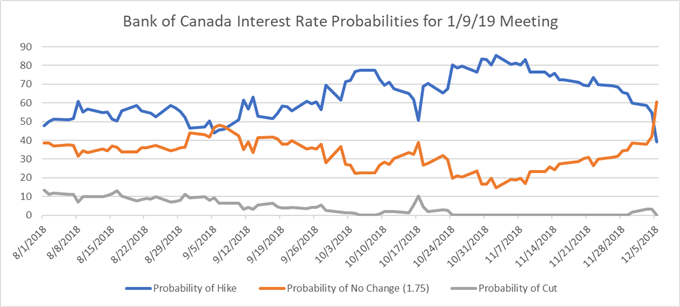
While inflation is expected to wane moving forward, the central bank alluded to possible future policy rate increases to a neutral level in order to maintain its inflation target. Trend inflation remains at reasonable levels in Canada, although the CPI for October was slightly above BOC’s target range at 2.4 percent. Expected inflation shows prices moderating as the effects of lower gas prices trickle down and the impact of minimum wage increases earlier in the year dissipate. Markets seem to disagree judging by the futures implied probability of a 25 basis point increase in the central bank’s overnight policy rate. The option market now prices a 39.3 percent change of a hike at January’s meeting which is down from 59.4 percent yesterday.

Bank of Canada Interest Rate Probabilities for January 2019

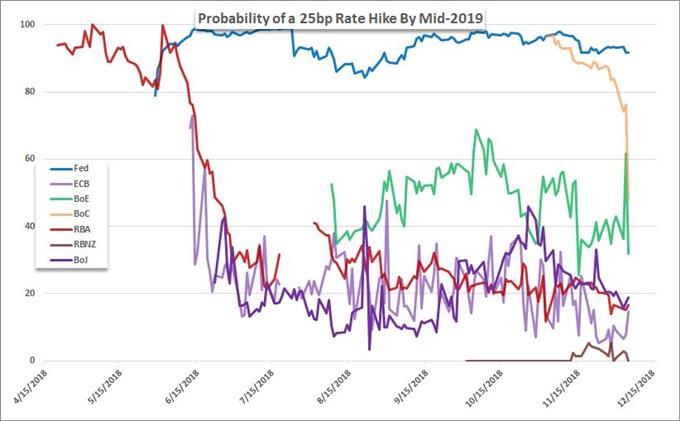
The expectation of lower future interest rates is not isolated to Canada. Below is a graphic listing the probabilities of a 25 basis point increase by mid-2019 across major central banks.

Central Bank Interest Rate Hike Expectations Price Chart

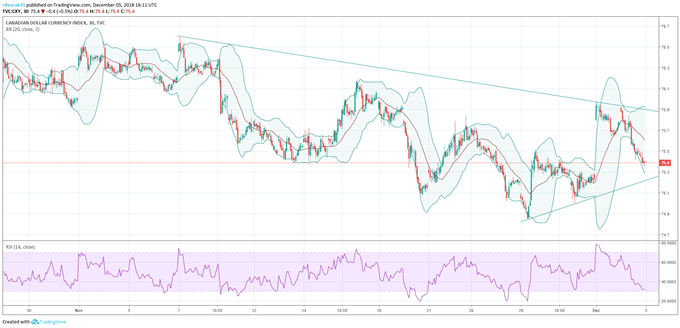
The press release sent the loonie lower as seen in the Canadian Dollar Currency Index Price Chart (15-Minute Bars) below. Markets will turn their attention to Canadian employment numbers reported this Friday and housing stats on tap for next week. The next BOC meeting will be held on January 9, 2019.

Canadian Dollar Currency Price Chart (15-Minute Bars)

–Written by Rich Dvorak, Junior Analyst for DailyFX.com

–Follow on Twitter @RichDvorakFX


Source link


https://ift.tt/2QjWzYc

Bitcoin, Ethereum, Ripple: Updated Charts and Prices


Bitcoin, Bitcoin Cash, Ethereum, Ripple: Prices, Charts and Analysis

  • Bitcoin Cash stuck in oversold territory.
  • Below USD100 billion market cap will trigger a wave of negative headlines.

Cryptocurrency Market Drifting Lower

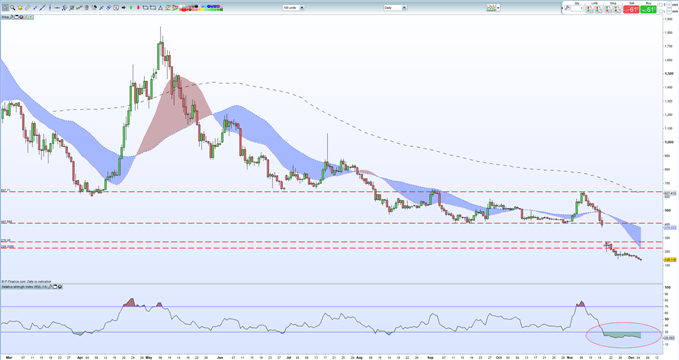
A range of cryptos are in oversold territory, using the RSI indicator, and may bounce in the short-term although gains will likely be limited. Charts continue to paint a long-term negative picture with lower highs continuing to dominate. Markets are becoming stretched on the downside, while trading ranges remain tight and volumes remain low. Bitcoin Cash (BCH) looks increasingly oversold and may move higher in the short-term.

Bitcoin Cash (BCH) Daily Price Chart (February – December 5, 2018)

Bitcoin, Ethereum, Ripple: Updated Charts and Prices | Webinar

The cryptocurrency market cap currently stands around USD125 billion, just USD10 billion off this year’s low. If Bitcoin (BTC) falls to the next support level around USD2,970, then overall market cap will near or break below USD100 billion, triggering a round of negative headlines. Recall that this time last year, market commentary was suggesting a market cap of USD1 trillion or more.

Investors remain net-long cryptocurrencies but recent changes give us a mixed trading bias – for example the number of traders net-short Bitcoin is up from last week. You can sign up to the IG Client Sentiment Indicator for free to get updated positioning data.

Cryptocurrency Trader Resources – Free Practice Trading Accounts, Guides, Sentiment Indicators and Webinars

If you are interested in trading Bitcoin, Bitcoin Cash, Ethereum, Litecoin or Ripple we can help you begin your journey. We have an Introduction to Bitcoin Trading Guide along with a Free Demo Account so you can practice trading this volatile asset class.

What’s your opinion on the latest cryptocurrency sell-off? Share your thoughts and ideas with us using the comments section at the end of the article or you can contact me on Twitter @nickcawley1 or via email at nicholas.cawley@ig.com.

— Written by Nick Cawley, Analyst.


Source link


https://ift.tt/2PkCMCk

USD Price Gains Likely to be Short-Lived


USD price, news and analysis:

  • The USD price is bouncing modestly but any further gains will be hard to achieve as analysts worry about early signs of a US economic downturn.
  • The US Treasury yield curve continues to flatten and concerns remain about the US-China trade war.

USD price on shaky ground

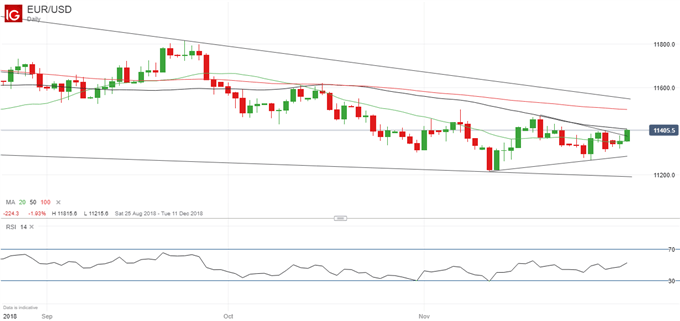
A modest rally in the US Dollar is unlikely to extend much further as traders worry about the US-China trade war and a continued flattening of the US Treasury yield curve. In Europe Wednesday, USD was higher against the Japanese Yen, the Australian Dollar and the Canadian Dollar, as well as the Euro.

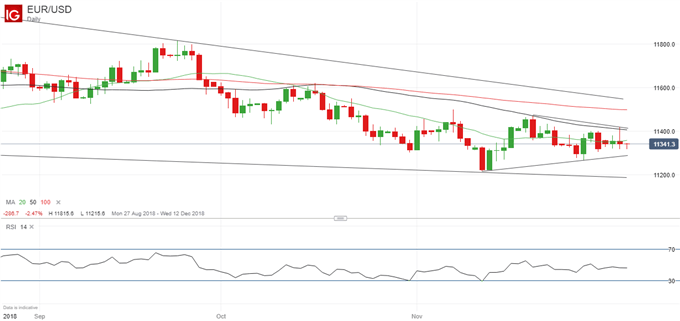
EURUSD Price Chart, Daily Timeframe (August 27 – December 5, 2018)

Latest EURUSD price chart.

Chart by IG (You can click on it for a larger image)

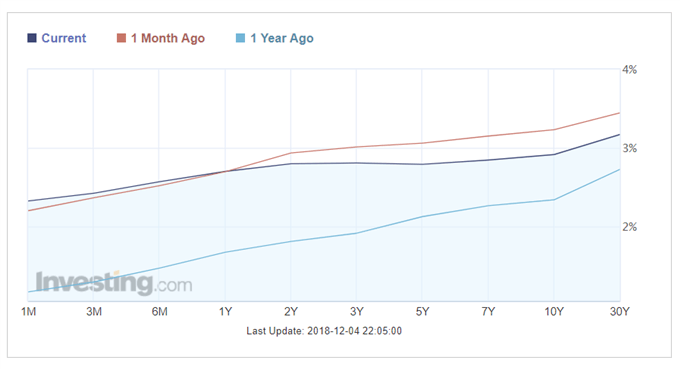
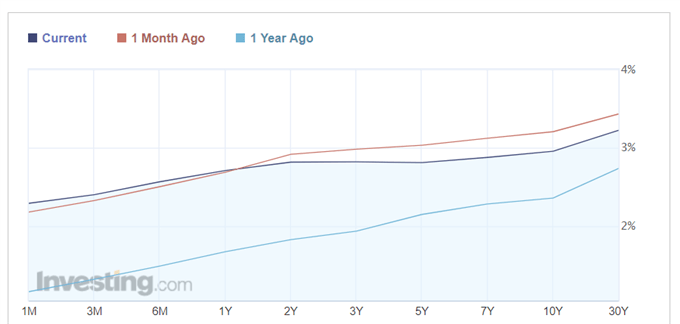
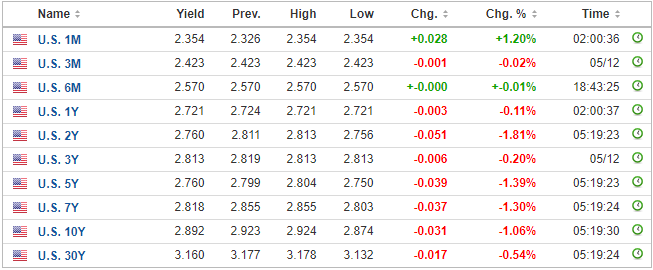
Behind the latest bounce is a continued flattening of the US yield curve, with the yield on the 10-year Treasury note at 2.915%, its lowest since early September and only just above the two-year yield at 2.799%. Between two years and five years the curve has already inverted, with the two-year yield now just above the five-year yield at 2.791%.

US Treasury yield curve

Latest US Treasury yield curve.

Source: Investing.com

An inverted yield curve is seen by some economists as a warning of an economic downturn or even a recession. If that proves to be the case, the US Federal Reserve will likely end its rate-hiking cycle earlier than previously expected – which would be negative for USD.

Meanwhile, worries about whether the ceasefire in the US-China trade war will hold are continuing to damage market risk sentiment, leading to demand for safe havens such as the Japanese Yen and the Swiss Franc. China has now said it is confident a trade deal can be reached but the truce remains fragile.

More to read:

A Brief History of Trade Wars | Infographic

Resources to help you trade the forex markets:

Whether you are a new or an experienced trader, at DailyFX we have many resources to help you:

— Written by Martin Essex, Analyst and Editor

Feel free to contact me via the comments section below, via email at martin.essex@ig.com or on Twitter @MartinSEssex


Source link


https://ift.tt/2G0CeCo

mardi 4 décembre 2018

Asian Stocks Fade With Wall Street, Plentiful Economic Cues Ahead


Asian Stocks Talking Points:

  • Markets were lower across the bord
  • Australian growth data came in weak, which didn’t help and already gloomy mood
  • The Dollar remained under pressure with Treasury yields in focus

Find out what retail foreign exchange investors make of your favorite currency’s chances right now at the DailyFX Sentiment Page

Wednesday was always going to be tough for Asia Pacific stocks given the clobbering Wall Street took in the previous session. US investors took fright as they fretted the details of last weekend’s US/China trade truce and worried about the possibility of economic deceleration ahead.

These worries were hardly lessened in Asian hours by a third-quarter Australian Gross Domestic Product which came in well below forecasts. Bulls may cling to the thesis that, even now, Australia is growing more strongly than many comparable Western economies, and look with hope to a real trade deal between Washington and Beijing. That would surely see the Australian economy accelerate again. However, the most recent data were a disappointment.

The Nikkei 225 was down 0.6% as its close loomed Wednesday. Shanghai was off by 0.7% with the Hang Seng down 1.8%. The ASX 200 slipped 0.8% with the banking sector under special pressure. Those weak Australian growth numbers suggest that local interest rates will be staying at their already venerable record lows for the foreseeable future.

The US Dollar remained defensive as the markets surveyed a bit of yield curve inversion in the US. This was visible in the yields between three and five years, and between two and five years. It suggests that worries about an economic slowdown are becoming entrenched. Still, the Australian Dollar’s weakness against the greenback was also clear.

AUD/USD has now it seems failed to hold at the three-month highs seen late last month.

Australian Dollar Vs US Dollar, Daily Chart

Although its dominant uptrend still clearly endures, current price action suggests that that trend’s base will be tested either later this week or early next. Gold prices slipped back a little from its recent one-month highs while crude oil prices slid further on growth worries and signs of rising US supply.

There remains plenty of economic meat still to chew over on Wednesday’s bones. Purchasing Managers Indexes are coming up from various European countries, including France, Germany and the UK. The Bank of Canada will give its interest rate dispensation, with no change expected. From the US will come the non-manufacturing snapshot from the Institute for Supply Management and news of mortgage application levels. The employment survey from Automatic Data Processing is also due, along with crude oil inventories from the Department of Energy.

Resources for Traders

Whether you’re new to trading or an old hand DailyFX has plenty of resources to help you. There’s our trading sentiment indicator which shows you live how IG clients are positioned right now. We also hold educational and analytical webinars and offer trading guides, with one specifically aimed at those new to foreign exchange markets. There’s also a Bitcoin guide. Be sure to make the most of them all. They were written by our seasoned trading experts and they’re all free.

— Written by David Cottle, DailyFX Research

Follow David on Twitter@DavidCottleFX or use the Comments section below to get in touch!


Source link


https://ift.tt/2UmvVMC

Australian Dollar Falls as Soft GDP Data Cools RBA Rate Hike Bets


TALKING POINTS – AUSTRALIAN DOLLAR, GDP, RBA, BOND YIELDS

  • Australian Dollar fell after disappointing GDP data was released
  • Local two-year government bond yields fell alongside the currency
  • RBA rate hike bets cooled after chilly data came across the wires

Trade all the major global economic data live and interactive at the DailyFX Webinars. We’d love for you to join!

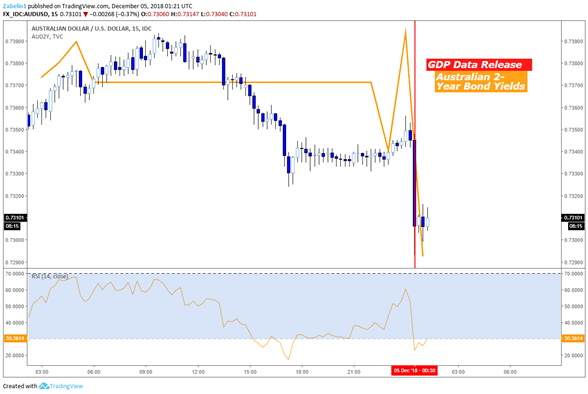
The Australian Dollar fell as Australia’s third-quarter GDP data crossed the wires. The year-on-year growth rate slowed to 2.8% versus 3.3% expected. The currency fell alongside local 2-year bond yields, hinting that traders to read the outcome to mean that an RBA rate hike might come later than previously expected. The next increase is priced in to come no sooner than in December 2019.

The Australian Dollar’s fall following the GDP report is part of a broader downtrend path the Aussie has been running on since the beginning of the year. Despite the boon granted to the cycle-sensitive asset during after the weekend’s G20 summit – where trade tensions between the US and China seemingly dialed down – the global outlook for growth remains uncertain amid doubts that Beijing and Washington are truly prepared permanently end the trade war.

Australian Dollar Down After GDP Data Crossed the Wires

AUD/USD - Daily Chart

Looking ahead, the Australian Dollar is likely to continue its downtrend as the sentiment-linked asset closely watches broader risk trends. The gloomy outlook for growth will likely continue to eat away at risk appetite and undermine the desire to hold a risk-loving asset.

AUD/USD TRADING RESOURCES

— Written by Dimitri Zabelin, Jr Currency Analyst for DailyFX.com

To contact Dimitri, use the comments section below or @ZabelinDimitrion Twitter


Source link


https://ift.tt/2SvseCC

USD Price Eases Further Despite Doubts About US-China Trade War Truce


USD price, news and analysis:

  • The USD price is weakening further: down Monday on news of a US-China trade war ceasefire, down Tuesday on misgivings that a long-term deal can be agreed.
  • That may be because the US Treasury yield curve has flattened and partly inverted, seen by some as a harbinger of recession.

USD Price Still Under Downward Pressure

The USD price is easing again Tuesday as doubts emerge that a long-term US-China trade war deal can be reached after slipping back Monday on news of a temporary truce. US President Donald Trump and China President Xi Jinping have decided to hold off from imposing new tariffs for 90 days while they negotiate an agreement.

However, concerns surfaced Tuesday about whether a long-term agreement is achievable. That might have been expected to give the US Dollar a lift given its status as a safe haven when risk aversion rises. Instead, it dropped again, implying that other forces are influencing it too.

EURUSD Price Chart, Daily Timeframe (August 27 – December 4, 2018)

Latest EURUSD price chart.

Chart by IG Click on the chart for a larger image

As the chart of EURUSD above shows, the pair is extending its gains as the US Dollar weakens and from a technical perspective has broken to the upside from a triangle pattern, implying further gains are now possible.

That could be in part because the US Treasury yield curve has flattened and partly inverted.

US Yield Curve Chart

Latest US yield curve chart.

Source: Investing.com

The curve is now flatter than it was both a month ago and a year ago, while the curve has inverted between two years and five years, sometimes seen as a warning of a possible recession that would lead to lower US interest rates and reduce the attractions of the Dollar.

While this seems unlikely at present, it perhaps suggests that the outlook for USD is less positive than it seemed as recently as Monday.

More to read:

A Brief History of Trade Wars | Infographic

Trade Wars and Tariffs: The Impact on Europe, EUR, GBP and Stocks

Resources to help you trade the forex markets:

Whether you are a new or an experienced trader, at DailyFX we have many resources to help you:

— Written by Martin Essex, Analyst and Editor

Feel free to contact me via the comments section below, via email at martin.essex@ig.com or on Twitter @MartinSEssex


Source link


https://ift.tt/2KUO67Q