samedi 8 décembre 2018

Dollar Wind Up Threatens to Resolve with a Break Before 2018 Ends


Talking Points:

  • Recent congestion behind the Dollar sets up an eventual break but liquidity is a serious constraint
  • Volatility in the broader financial system will play a critical role as to the Dollar’s bearing and tempo
  • See how retail FX traders are positioning in Dollar-based majors like EURUSD on the sentiment page

Technical Forecast for US Dollar: Bearish

Considered on its own, the Dollar looks almost sanguine. The currency worked its way deeper into a range that will have to end with a break soon. Of course, a break does not have to translate into the explosive moves that catalyze major trends – even though we may always be on the hunt for such resolutions. There is actually an momentous force that will be working against the currency’s ability to transition its necessary breach from a dwindling range into full-fledge trend: liquidity. We are heading into the final weeks of the year, a period that historically sees a systemic reduction in participation owing to holiday closures, accounting maneuvers and simple habit. Yet, to assume a forcible quiet in the capital markets from such prosaic influences against a year of exceptional volatility would be more than complacent – it would be negligent. There would be little downside to prepare for volatility should there be no decisive moves from risk assets or the Greenback. However, the assumption versus realization of the opposite can translate to serious exposure risk and loss of opportunities for those trading the majors.

Chart DXY Dollar Index (4-Hour)
Dollar Wind Up Threatens to Resolve with a Break Before 2018 Ends

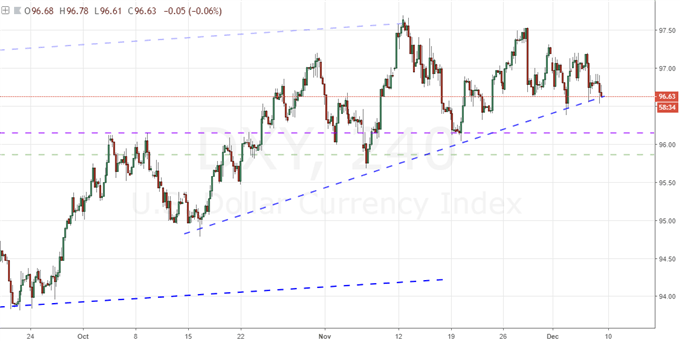
Looking to the trade-weighted Dollar index, the congestion is readily apparent. The swing high from early November – the highest level for this measure since June 2017 – is not far from where we end this past week. Theoretically, it would not take a significant charge to return the market to that level and possibly force a break. While 98 is a significant technical ceiling, it would likely be difficult to simply muster the level of appetite necessary to simply break short-term resistance and reach that figure – much less surpass it. The ‘path of least resistance’ in this case would be a break to the down side which could open up support established through the second half of the year down around 94. Such a move would still be difficult to build up to, but it still wouldn’t come with an inherent assumption of a full-blown trend.

Chart EURUSD (Daily)
Dollar Wind Up Threatens to Resolve with a Break Before 2018 Ends

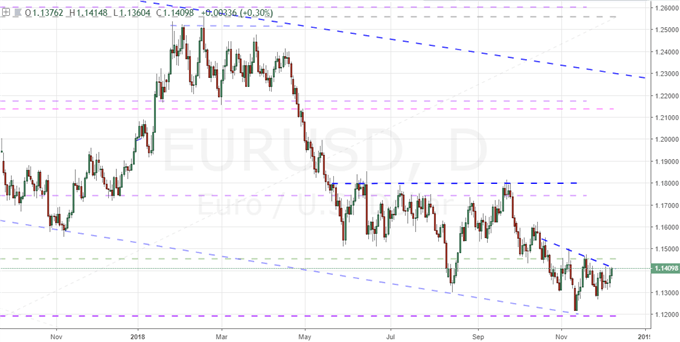
Looking into the major component of the DXY – EURUSD which accounts for approximately two-thirds of the measure – the picture is inverted but the same implications are apparent. There is a prevailing trend here (bearish or bullish for the Dollar), but the hesitation for progress is apparent. Price action over the past six weeks on this benchmark could readily qualify for an inverse head-and-shoulders pattern. Yet, the make up of the chart pattern alone means little. This classic pattern is used to qualify possible reversals, and there is a critical change in both tempo and direction that occurs under such circumstances. This is difficult to reconcile against the inevitable drained liquidity that we will be dealing with these coming weeks. That said, high volatility against a thin market can lead to more severe – if shorter-lived – moves.

Chart of Equally-Weighted Dollar Index (Daily)
Dollar Wind Up Threatens to Resolve with a Break Before 2018 Ends

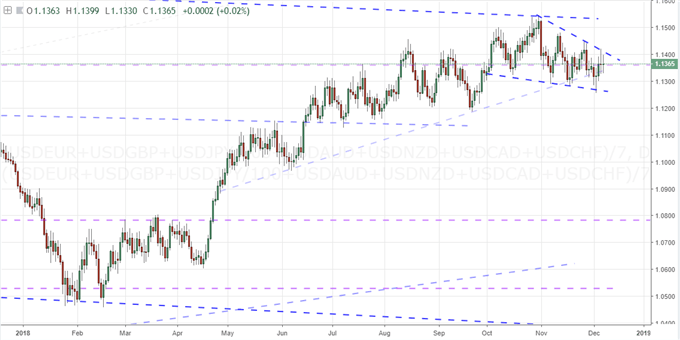
With a look to an equally-weighted index, the general quality of the Dollar’s bearings do not change. Consolidation is even more apparent in this measure of the currency’s bearings while the technical lines are little more explicit. Consolidation is both common as pauses in prevailing trends as well as hesitation before reversal. The longer the indecision, the closer the conclusion’s outcome moves to a 50/50 chance. This is the longest period of reservation we have seen from the Greenback since it began its current bullish phase at the beginning of the year.

Chart of DXY Dollar Index and VXX Short-Term Volatility ETF (Daily)
Dollar Wind Up Threatens to Resolve with a Break Before 2018 Ends

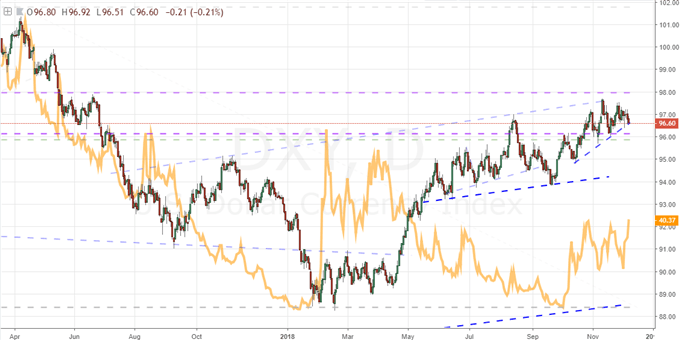
If you want to evaluate the potential for the Dollar in both direction of a break and follow through thereafter, there are few complementary charts that are worthy for frequent reference. The most pressurized catalyst for Dollar movement would be general market volatility. At different intensities of market activity, the Dollar will revert to different roles. If volatility is low or dropping rapidly, the currency would more likely see its carry trade appeal bolstered, but there may also be a moderate level of premium afforded to its safe haven status that would cool. Should risk aversion kick in a meaningful – though not severe – way, the currency is more likely to slide. Such a move would exploit the currency’s buoyancy through 2018 on the back of the carry trade premium that has built up. If, despite the anticipated fade in liquidity, markets explode and volatility surges, need for liquidity will revert the Dollar to its deep safe haven state and stoke a lasting bid. Above is the VXX ETF which measures short term volatility – and the market’s appetite to speculate on it…

Chart of DXY Dollar Index and Implied Fed Funds Yield Curve Dec to Jan 2019 (Daily)
Dollar Wind Up Threatens to Resolve with a Break Before 2018 Ends

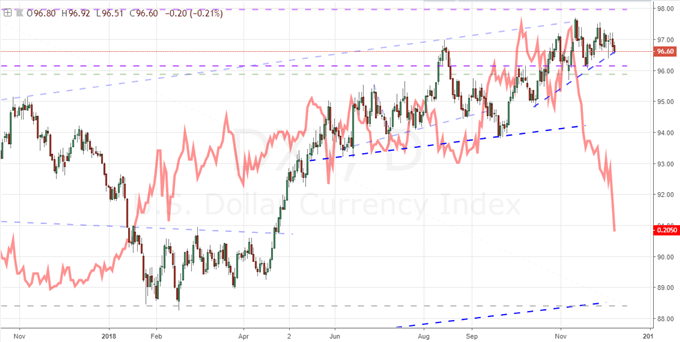
A rise or fall in volatility can establish different bearings for the Greenback, but to truly get a strong fix on its intent, you should consider that filter against another important measure – the anticipation of rates moving forward. Above is the expected Fed rate forecast via the curve through 2019. In other words, it looks at the forecasted rate Fed Funds rate in December versus January. Should it rise, that reflects anticipation of a steadily rising interest rate which is like a rising dividend for currencies. Should it drop – as it has this past month – it weighs on the perceived premium. Notably, the Dollar has held strong, but add some risk aversion to this equation, and it may be difficult to hold back the tide.

Chart of Net Speculative Positioning in Dollar Futures Contracts (Weekly)
Dollar Wind Up Threatens to Resolve with a Break Before 2018 Ends

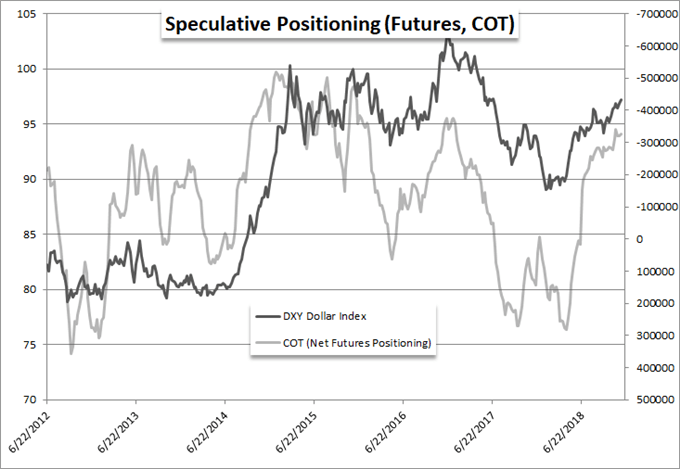
The fuel to charge any fire – bullish or bearish – depends on the speculative depth the markets are able to muster. Liquidity is one aspect to that, but so too is the capacity for further build up of a net long position or conversely a deleveraging. Over the past few months, net speculative futures positioning behind Dollar contracts has struggled to make any significant progess following the dramatic reversal from the most bearish exposure in five years around the middle of the year. It is possible to warm bullish expectations, but to mount a dramatic appetite from the level of exposure this reflects is difficult to envision. Much easier to imagine is an abrupt reversal and the fleeing bullish exposure it would represent as the market deleverages.

Other Weekly Technical Forecast:

Australian Dollar Forecast – AUD/USD, AUD/JPY and EUR/AUD Trend Lines Broken

British Pound Forecast – Sterling Remains Weak


Source link


https://ift.tt/2QDp6au

Foundations of Technical Analysis: Seeing the Forest from the Trees


Identifying opportunities and how to use leverage effectively- a review of our technical approach and examples that illustrate our trading methodology in practice.


Source link


https://ift.tt/2SCC99q

vendredi 7 décembre 2018

GBPUSD Weekly Technical Outlook: Sterling Remains Weak


GBPUSD Technical Analysis

  • Triangle breakout on the four-hour chart nears.
  • Daily chart signals a re-test of the recent low.

We have recently released our Q4 Trading Forecasts for a wide range of Currencies and Commodities, including GBPUSD with our fundamental and medium-term term technical outlook.

GBPUSD – Short-term Breakout Nears

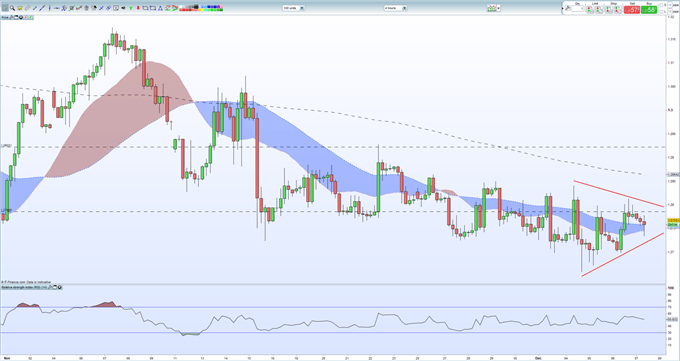
GBPUSD is currently rangebound and stuck within a triangle, pointing to a breakout in the short-term, and the downside looks more likely in the current environment. The pair are currently trading above the 20- and 50-day moving average, but any upside momentum is going to find resistance around 1.2800 – 1.2820. Sterling bulls may point to the recent higher lows being made as a sign of strength but a break below 1.2730 would negate this and leave the pair vulnerable to further falls with the recent multi-month low at 1.2658 the first target.

GBPUSD Four-Hour Price Chart December 7, 2018

GBPUSD Weekly Technical Outlook: Sterling Remains Weak

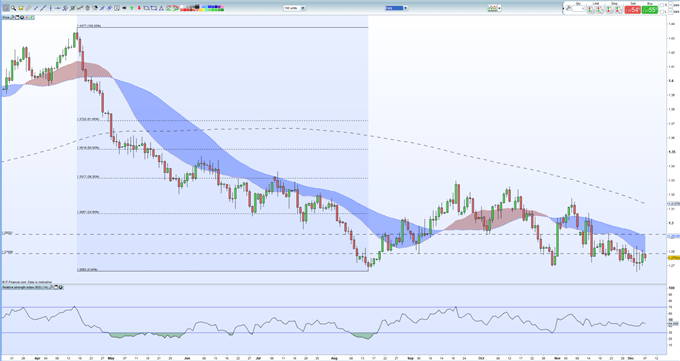
The daily GBPUSD chart paints a slightly different picture with lower highs dominating. The pair also trade below all three moving averages, with the 20 and 50-day mas providing resistance all the way back up to 1.2822. A break and close below the October 30 low at 1.2694 leaves 1.2658 vulnerable for a re-test.

GBPUSD Daily Price Chart December 7, 2018

GBPUSD Weekly Technical Outlook: Sterling Remains Weak

While the technical outlook may point to lower prices, the IG Retail Sentiment Indicator is suggesting that GBPUSD may move higher. Traders are 63.1% net-long GBPUSD – a bearish contrarian indicator – yet traders are less net-long than yesteday and compared with last week. This suggets that GBPUSD may move higher despite the fact that traders are net-long.

— Written by Nick Cawley, Analyst

To contact Nick, email him at nicholas.cawley@ig.com

Follow Nick on Twitter @nickcawley1

Other Weekly Technical Forecast:

Australian Dollar Forecast – AUD/USD, AUD/JPY and EUR/AUD Trend Lines Broken


Source link


https://ift.tt/2QlLQMw

Becoming a Better Trader – How to Create a Trading Plan


The importance of a trading plan can’t be overstated, but yet the number of traders who don’t have one far outnumbers those who do. Without a comprehensive plan of attack it is easy to get off course. Your plan doesn’t need to overly detailed, a couple of pages or so will do. There are a few key components which should be included, but keep in mind there is plenty of room for flexibility so as to tailor it to your needs. Keep this acronym in mind – K.I.S.S. (Keep It Simple Stupid) – as you go about constructing your trading plan.

Whether you are a new trader building a foundation or an experienced trader struggling (happens to the best), here are 4 ideas for Building Confidence in Trading

Must have a trading plan

In anything we set out to do, if we intend on it having a shot at success, don’t we plan ahead? Some type of plan? Then so it should be with trading. Markets are too dynamic, full of too much uncertainty, to try and navigate them without a framework in place. Trading plans are imperative for creating consistent results. They are also excellent for identifying strengths and weaknesses and then adjusting so you gravitate more towards what works and further away from what doesn’t.

What to include in your trading plan

Analytical approach

This is straight forward; what do you use to identify set-ups? It doesn’t matter so much what you use, just that it makes sense and is used consistently. It could be some combination of price support and resistance, trend-lines/slope analysis, chart patterns, Fibonacci levels, moving averages, Ichimoku Clouds, Elliot Wave Principle (EWP), sentiment, fundamentals, etc. Perhaps all together something else.

Favorite trade set-ups

What set-ups work best for you (get you excited)? It probably goes without saying, but these should be at the core of your trading. Set-ups are based on the alignment (confluence) of any number of factors which make for a high conviction trading opportunity. If you are new to trading, then this will take some time to figure out, so be patient in making progress towards understanding what works best for you.

A set-up is one thing, but how you execute it is another. We discussed this in detail in this 3-part series (Trading Breakouts | Trading Pullbacks | Combining Breakouts & Pullbacks). To recap one key point: There is the set-up, then the method by which you will take advantage of the set-up. For example, three traders could identify the same consolidation pattern; one will buy the breakout, another will wait for the first pullback after the breakout, and the third trader will do some combination of the two. Knowing how you best execute trades and what works for you is important.

What markets will you focus on?

Not every market moves the same, not everyone has the same interest in trading the same markets. Know which markets you focus on. It’s a good idea to keep your universe relatively small, helps keep things simple, and allows you to learn the personalities of the targeted markets and/or currencies. You can take it a step further and focus on specific time-frames for each market category. For example, you may trade equity indices on a very short-term time horizon (days or less), but choose to trade FX from a swing-trader standpoint (several days to several weeks). You could also have dynamic exposure to one market over another, i.e. – 75% FX, 25% indices/commodities.

Time-frame, hold time

What is the intended hold time for your trades, on average? Are you a swing-trader, holding for several days to weeks using weekly/daily/4-hr charts, or do you focus on day-trading, with hold times of a few hours or less, thus using daily down to even a 1-minute chart? It could be some blend of the two.

We understand the difficulties of trading, which is why we’ve put together a variety of guides designed to help traders of all experience levels.

Risk management

While we discussed this later in the webinar, the order is certainly not indicative of its importance. Without good risk management none of the rest of the trading plan will matter, at least not for long… You need to know your risk tolerance and adopt a risk management strategy which fits you. Know how much risk-per-trade you will take and total account risk across several positions. What is the max number of positions you will hold at once? (Fewer are easier to manage.)

Have a max drawdown figure in place as ‘kill switch’ when things aren’t going well. For example, if you experience a drawdown of 10% you will either take a break or at the least reduce your trading size. Remember, job #1 is capital preservation. (For more details, check out this webinar on risk management.)

Handling adversity (and success)

When you hit the inevitable drawdown, what will you do to make sure it doesn’t become damaging? You should reduce your trading size or stop trading altogether for a short period of time so you can alleviate stress and figure out what is going wrong. It is very important to have a plan for this before it happens.

It is also important to have a plan in place for when things are going well. Overconfidence can be a killer and lead to a drawdown if not correctly managed. While it is good to press it when market conditions are conducive and you’re doing well, but you need to do so responsibly. Increasing your risk by 50% isn’t out of control, but suddenly quadrupling it is, and will likely lead to a frustrating outcome.

Have a routine for staying on track

You should set aside time to reflect on the week’s events and how you traded. It’s a good idea to regularly review your trading plan and make tweaks if necessary. Periodical trade review and journaling are excellent ways to ensure you are following the process you have outlined in your plan, as well as identify patterns in your trading. Save charts of trade set-ups which stick out to you or you did well/poorly on for review later on.

Be rigid with your plan, but not too rigid. This can take some time for the newer trader to fully understand, but you want to have some flexibility in following your plan so as to not become too robotic. Unless you are trading with an algorithm, there is a ‘feel’ component to trading which should be incorporated. The more experienced you are the more this comes into play. The purpose of a plan and rules is to give you a strong foundation and boundaries to operate within…

For the full conversation, please see the video above…

Enjoy the video? Join Paul or any of the team’s analysts live each week for webinars covering analysis, fundamental events, and education.

Past recordings you might be interested in: Handling Drawdowns; Risk Management; Analysis, keeping it simple; 6 Mistakes Traders Make; Focusing on the Process; Building Consistency; Classic Chart Patterns, Part I;Classic Chart Patterns, Part II

—Written by Paul Robinson, Market Analyst

You can follow Paul on Twitter at @PaulRobinsonFX


Source link


https://ift.tt/2RDyrMI

Markets Crash to Fresh Yearly Lows


Bitcoin, Bitcoin Cash, Ethereum, Ripple: Prices, Charts and Analysis

  • Cryptocurrency market hits a fresh 2018 low and market cap may fall below $100 billion.
  • Bitcoin Cash (BCH) is in freefall.

Cryptocurrency Market Hammered Lower

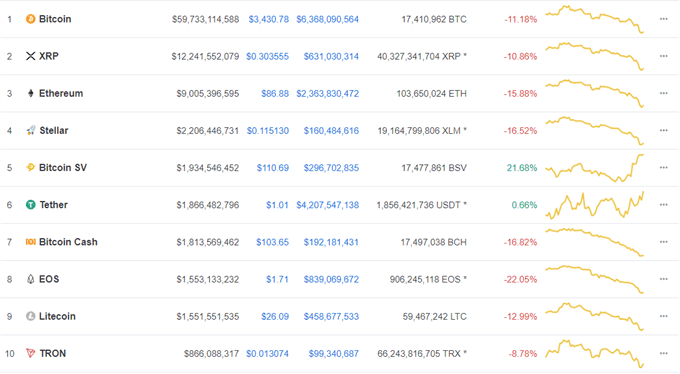
The cryptocurrency market as a whole made a fresh low for 2018 with its market cap falling to just over $108 billion, down from $835 billion at the start of the year. Turnover picked up as the market fell – a negative sign – while a lot of the charts have no solid support lines/areas left that are clear and qualifiable.

News that the SEC had once again delayed a decision on the VanEck bitcoin ETF until the end of February 2019 sent the market spinning lower. The SEC said that it is ‘appropriate to designate a longer period within which to issue an order approving or disapproving the proposed rule change so that it has sufficient time to consider this proposed rule change.’ The worry for the VanEck ETF is that continued market volatility will make it harder for the SEC to allow it to issue an ETF.

Many of the top 10 cryptos are suffering double-digit losses in the last 24 hours, taking out weak support levels along the way. Bitcoin (BTC) continues to trade towards support at just under $3,000, and if this breaks the July 16, 2017 swing low at $1,780 comes into play. Ethereum (ETH) currently trades around $84 and is now looking at the May 2017 swing-low at $62, while Litecoin (LTC) trades at $25 and may fall to the May 2017 low around $18. Bitcoin Cash (BCH) has probably been the largest fallers in the past few weeks, slumping from $634 to $100 in just one month.

Bitcoin, Ethereum, Ripple: Markets Crash to Fresh Yearly Lows

Investors remain net-long cryptocurrencies but recent changes give us a mixed trading bias – for example the number of traders net-short Bitcoin is up from last week. You can sign up to the IG Client Sentiment Indicator for free to get updated positioning data.

Cryptocurrency Trader Resources – Free Practice Trading Accounts, Guides, Sentiment Indicators and Webinars

If you are interested in trading Bitcoin, Bitcoin Cash, Ethereum, Litecoin or Ripple we can help you begin your journey. We have an Introduction to Bitcoin Trading Guide along with a Free Demo Account so you can practice trading this volatile asset class.

What’s your opinion on the latest cryptocurrency sell-off? Share your thoughts and ideas with us using the comments section at the end of the article or you can contact me on Twitter @nickcawley1 or via email at nicholas.cawley@ig.com.

— Written by Nick Cawley, Analyst.


Source link


https://ift.tt/2BXqRXV

WTI Holds Near $50/bbl; Bounce May Very Well Be Bull Trap


Technical Crude Oil Price Talking Points:

  • The ONE Thing: A bounce could very well be a trap for bulls. There is a lot of resistance near $56/bbl.-$59/bbl. that could bring back sellers.
  • Per IGCS, Crude sentiment favors a bounce, but long-term bias remains negative
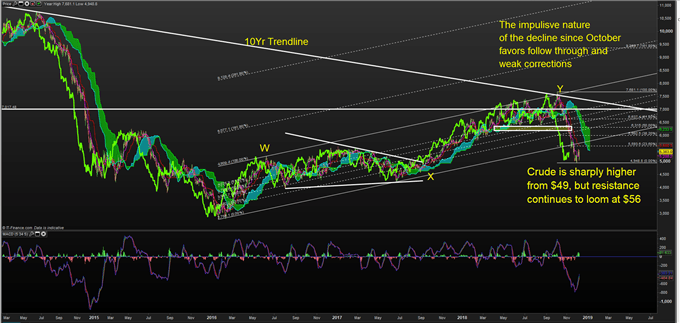
  • The Technical Picture: Selling rips appear to be preferred below the rising channel that was aggressively broken in this Q4 bear market in oil shown on the chart below. Crude is sharply higher from $49, but resistance continues to loom at $56New targets surface at $42-39, which becomes increasingly likely if US Dollar strength can continue.

Technical Forecast for <USOIL>: Bearish

WTI Holds Near $50/bbl; Bounce May Very Well Be Bull Trap

Data Source: Bloomberg

Technical traders soon learn that moves rarely happen in isolation. In Elliott Wave (learn more here) moves in the direction of the trend tend to take place in five ways, and counter-trend moves tend to happen in three waves.

Regardless of whether you think this is a new bear market or a bull market correction (the latter is getting harder to argue), there appears to be more selling to come. However, a bounce, albeit a small bounce relative to the decline, could be taking form post-OPEC+.

Looking at the chart above, the clear resistance for such a bounce to terminate utilizing Ichimoku as a guide would be $56/bbl. (the 26-day midpoint and Kijun sen) or into the cloud near the 38.2% retracement of the October-November decline near $59/bbl. The latter level is also well within the cloud, which tends to catch the first true retracement before trend continuation.

Bottom buyers will no doubt be encouraged by the ~5% rally on Friday, but resistance continues to loom large at $56/59 with a worsening global economic growth outlook that could cause the wind to blow in the bears favor soon.

Sentiment Favors A Bounce, But Long-Term Bias Remains Negative

WTI Holds Near $50/bbl; Bounce May Very Well Be Bull Trap

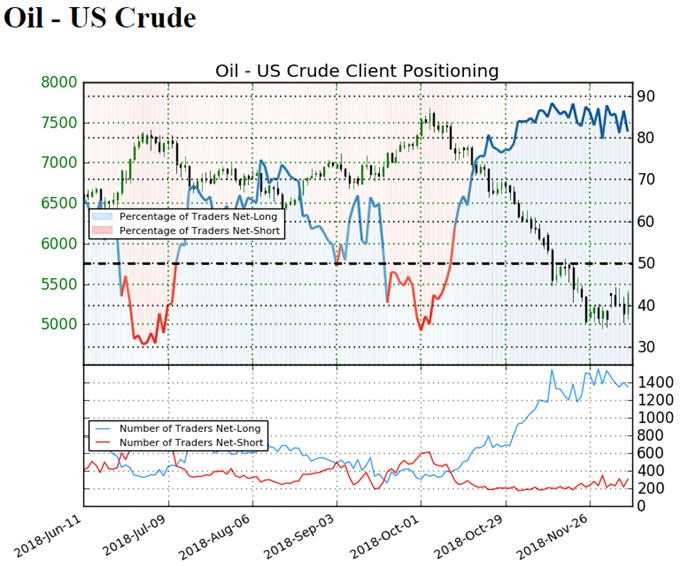
Oil – US Crude: Retail trader data shows 81.5% of traders are net-long with the ratio of traders long to short at 4.4 to 1.

In fact, traders have remained net-long since Oct 11 when Oil – US Crude traded near 7621.0; price has moved 29.5% lower since then. The number of traders net-long is 3.2% higher than yesterday and 7.2% lower from last week, while the number of traders net-short is 9.3% higher than yesterday and 6.1% lower from last week.

We typically take a contrarian view to crowd sentiment, and the fact traders are net-long suggests Oil – US Crude prices may continue to fall. Yet traders are less net-long than yesterday and compared with last week. Recent changes in sentiment warn that the current Oil – US Crude price trend may soon reverse higher despite the fact traders remain net-long (emphasis mine.)

—Written by Tyler Yell, CMT

Tyler Yell is a Chartered Market Technician. Tyler provides Technical analysis that is powered by fundamental factors on key markets as well as trading educational resources. Read more of Tyler’s Technical reports via his bio page.

Communicate with Tyler and have your shout below by posting in the comments area. Feel free to include your market views as well.

Checkout DailyFX’s New Podcast: Trading Global Market’s Decoded on iTunes

Talk markets on twitter @ForexYell

Other Weekly Technical Forecast:

Australian Dollar Forecast – AUD/USD, AUD/JPY and EUR/AUD Trend Lines Broken

British Pound Forecast – Sterling Remains Weak

US Dollar Forecast – Dollar Wind Up Threatens to Resolve with a Break Before 2018 Ends

Equity Forecast – Technical Forecast for the S&P 500, Dow Jones, DAX 30 & FTSE

Gold Forecast – Price Breakout Approaching Initial Targets


Source link


https://ift.tt/2BXXxjO

Successful Bear Market Trading Strategies & Techniques


Key Takeaways from the Trading Podcast:

  • How and when to adjust your position sizing when prices are volatile
  • Freeing up your margin by using less capital
  • Considering the opportunity cost of existing positions
  • Live to trade another day (absorb losses without blowing up your account)

Successful Bear Market Trading Strategies &amp; Techniques | Podcast

Adapting your approach in this trading environment is key to successful trading

In this week’s episode senior analyst, Tyler Yell, unpacks the recent spate of volatility in the markets and reveals how to tailor your approach to “Survive another day” should the move work against you.

Volatility has been cyclically depressed in recent years, appearing every so often but what we have seen in early 2018, and now toward the end of 2018, appears to be a pattern of volatility. So how should traders change their approach under such volatile conditions?

4 Bear Market Trading Strategies

Reduce position sizing

As volatility increases and price moves become more violent, reduce position sizes. Think of it this way, you can make twice as much money on half of the position in a bear market that exhibits 4 times its usual volatility. Reducing position sizes has the added benefit of keeping you calmer and help you to manage the emotions of trading.

Freeing up margin

An additional benefit stemming from lower position sizes is that you are left with more available margin. Put differently, you are using a lower proportion of your trading account which leaves ample room to take advantage of new trading opportunities. Typically, traders should have sufficient funds in the account to capitalise on volatility strategies such as, bear market rallies on short time frames and divergences that play out successfully.

Opportunity cost

This is probably one of the most overlooked bear market trading strategy as it is essentially a hidden cost. Regardless of the market, you’re looking for opportunities with an edge and in a fast-moving, volatile market, the positions that are losing tend to hold an opportunity cost that isn’t worth the potential profit.

By keeping an inventory of new opportunities, you’ll be less encouraged to keep losing trades and jump on new opportunities that volatility can take into the green quickly.

Live to trade another day

Keep the long-term in mind. The often-forgotten beauty of bear markets is that every day can present excellent opportunities for those that play both sides of the tape. While it may be exciting to trade large, one trade should never be so crucial that it can put you out of the game completely. James Stanley, who was recently interviewed on the show, sums it up perfectly when he says you should see each trade as Just One of a Thousand Insignificant, Little Trades.

Practical example of volatility seen in WTI Oil

Successful Bear Market Trading Strategies &amp; Techniques | Podcast

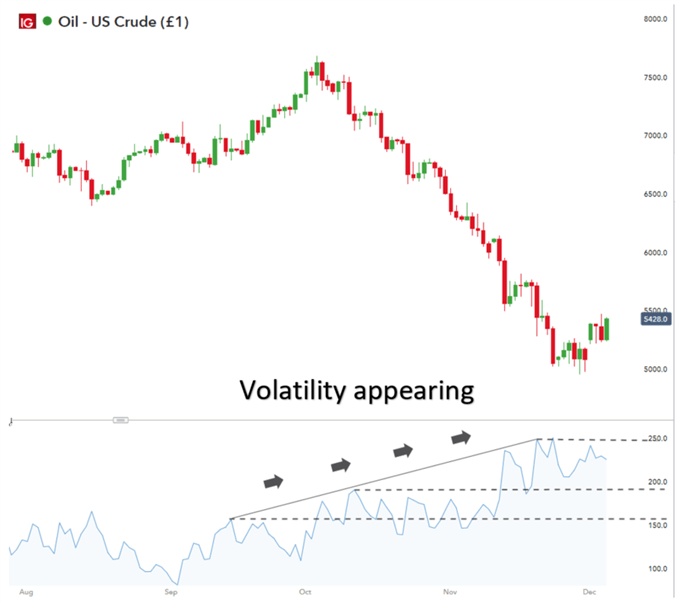
A helpful indicator that traders use to identify volatility is the Average True Range (ATR), which describes how much a market moves, on average, over a specified time(blue line).

Looking at the chart above, you will see that from August to September the ATR hovered around 160 points or less. The first sign of increased volatility surfaced around early to mid October and jumped even further in November. Traders should view the consistently higher volatility in October as a signal to reduce trading sizes. Reducing the trading size has the added benefit of freeing up margin for new trading opportunities. Such an opportunity appeared as WTI turned sharply lower.

The opportunity cost for long traders, in this example, is clear to see. Holding on to a long trade as the market moves lower and lower will increase your margin obligation and prevent you from taking advantage of new (more profitable) trading opportunities.

Adopting these strategies will increase the chances of you living to trade another day during turbulent markets.

Helpful resources:

  • If you are just starting out on your trading journey it is essential to understand the basics of Forex trading in our free New to Forex trading guide.
  • Jeremy Wagner, Head Forex Trading Instructor, provides a practical approach to trading volatile markets that all traders should be aware of.
  • If you are interested in a video example, Chief Currency Strategist, John Kicklighter, had produced an example on how to adopt a more Regimented Trading approach to volatile markets.
  • Upward trending markets don’t last forever which is why all traders should be able to identify and trade a bearish reversal.
  • Learn how to trade a bearish engulfing pattern.
  • At DailyFX we researched over 100,000 live IG Group accounts to find out the secrets of successful traders and published the findings in our Traits of Successful Traders.

If you found this article useful, you should follow our weekly podcasts. Whether you are looking for market analysis, trading education or interviews with well-known industry professionals, we have you covered.

Follow our podcasts on a platform that suits you:

iTunes:https://ift.tt/2L5G77R

Stitcher:https://ift.tt/2BXkZOh

Soundcloud:https://ift.tt/2L5G7Vp

Google Play:https://ift.tt/2BYjsaI


Source link


https://ift.tt/2L3SAcf